1. f(x)=x²+10x+16
use the formula to find the vertex = (-b/2a, f(-b/2a)) , here in the above equation a=1(as, a> 0 the parabola is open upward), b=10. by putting the values.
-b/2a = -10/2(1) = -5
f(-b/2a)= f(-5)= (-5)²+10(-5)+16= -9
so, vertex = (-5, -9)
now, find y- intercept put x=0 in the above equation. f(0)= 0+0+16, we get point (0,16).
now find x-intercept put y=0 in the above equation. 0= x²+10x+16
x²+10x+16=0 ⇒x²+8x+2x+16=0 ⇒x(x+8)+2(x+8)=0 ⇒(x+8)(x+2)=0 ⇒x=-8 , x=-2
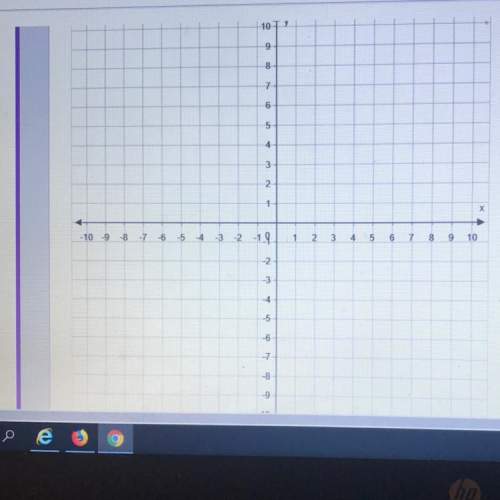
from vertex, y-intercept and x-intercept you can easily plot the graph of given parabolic equation. the graph is attached below.
2. f(x)=−(x−3)(x+1)
by multiplying the factors, the general form is f(x)= -x²+2x+3.
use the formula to find the vertex = (-b/2a, f(-b/2a)) , here in the above equation a=-1(as, a< 0 the parabola is open downward), b=2. by putting the values.
-b/2a = -2/2(-1) = 1
f(-b/2a)= f(1)=-(1)²+2(1)+3= 4
so, vertex = (1, 4)
now, find y- intercept put x=0 in the above equation. f(0)= 0+0+3, we get point (0, 3).
now find x-intercept put y=0 in the above equation. 0= -x²+2x+3.
-x²+2x+3=0 the factor form is already given in the question so, ⇒-(x-3)(x+1)=0 ⇒x=3 , x=-1
from vertex, y-intercept and x-intercept you can easily plot the graph of given parabolic equation. the graph is attached below.
3. f(x)= −x²+4
use the formula to find the vertex = (-b/2a, f(-b/2a)) , here in the above equation a=-1(as, a< 0 the parabola is open downward), b=0. by putting the values.
-b/2a = -0/2(-1) = 0
f(-b/2a)= f(0)= −(0)²+4 =4
so, vertex = (0, 4)
now, find y- intercept put x=0 in the above equation. f(0)= −(0)²+4, we get point (0, 4).
now find x-intercept put y=0 in the above equation. 0= −x²+4
−x²+4=0 ⇒-(x²-4)=0 ⇒ -(x-2)(x+2)=0 ⇒x=2 , x=-2
from vertex, y-intercept and x-intercept you can easily plot the graph of given parabolic equation. the graph is attached below.
4. f(x)=2x²+16x+30
use the formula to find the vertex = (-b/2a, f(-b/2a)) , here in the above equation a=2(as, a> 0 the parabola is open upward), b=16. by putting the values.
-b/2a = -16/2(2) = -4
f(-b/2a)= f(-4)= 2(-4)²+16(-4)+30 = -2
so, vertex = (-4, -2)
now, find y- intercept put x=0 in the above equation. f(0)= 0+0+30, we get point (0, 30).
now find x-intercept put y=0 in the above equation. 0=2x²+16x+30
2x²+16x+30=0 ⇒2(x²+8x+15)=0 ⇒x²+8x+15=0 ⇒x²+5x+3x+15=0 ⇒x(x+5)+3(x+5)=0 ⇒(x+5)(x+3)=0 ⇒x=-5 , x= -3
from vertex, y-intercept and x-intercept you can easily plot the graph of given parabolic equation. the graph is attached below.
5. y=(x+2)²+4
the general form of parabola is y=a(x-h)²+k , where vertex = (h,k)
if a> 0 parabola is opened upward.
if a< 0 parabola is opened downward.
compare the given equation with general form of parabola.
-h=2 ⇒h=-2
k=4
so, vertex= (-2, 4)
as, a=1 which is greater than 0 so parabola is opened upward and the graph has minimum.
hope this : )


