
Mathematics, 16.05.2021 18:10 Joeeeeeeee8974
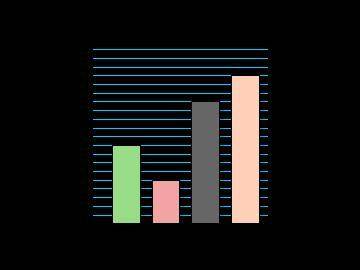
The bar graph shows the number of students who earned each letter grade on an exam. Which statement about the graph is true?
1/5 of the students earned a C.
3% more students earned an A than a B.
20% of the class earned a D.
1/4 of the class earned a B

Answers: 3


Other questions on the subject: Mathematics
Mathematics, 21.06.2019 22:00, angeloliv1012
Solve 2 - 3 cos x = 5 + 3 cos x for 0° ≤ x ≤ 180° a. 150° b. 30° c. 60° d. 120°
Answers: 1
You know the right answer?
The bar graph shows the number of students who earned each letter grade on an exam. Which statement...
Questions in other subjects:
Mathematics, 16.12.2021 03:40

Mathematics, 16.12.2021 03:40
Mathematics, 16.12.2021 03:40
Mathematics, 16.12.2021 03:40

Chemistry, 16.12.2021 03:40


