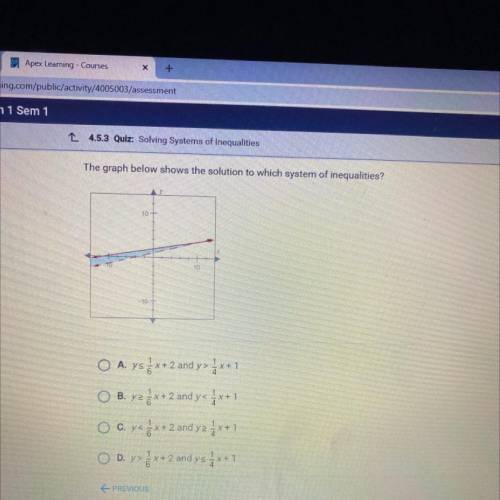
The graph below shows the solution to which system of inequalities?
...

Mathematics, 14.05.2021 05:20 aaron2113
The graph below shows the solution to which system of inequalities?

Answers: 3


Other questions on the subject: Mathematics
Mathematics, 21.06.2019 19:30, thisusernameistaken2
Complete the solution of the equation. find the value of y when x equals to 1 9x-5y=29
Answers: 2
Mathematics, 21.06.2019 21:10, benallyadam2067
Hey free points ! people i have a few math questions on my profile consider looking at them i have to get done in 30 mins!
Answers: 1
Mathematics, 21.06.2019 21:30, drepeter86
50 people men and women were asked if they watched at least one sport on tv. 20 of the people surveyed are women, but only 9 of them watch at least one sport on tv. 16 of the men watch at least one sport on tv. make a a two-way table and a relative frequency table to represent the data.
Answers: 3
You know the right answer?
Questions in other subjects:
Mathematics, 09.01.2021 19:10


Mathematics, 09.01.2021 19:10

Mathematics, 09.01.2021 19:10
English, 09.01.2021 19:10


