
Mathematics, 14.05.2021 01:00 johnsonraiah5320
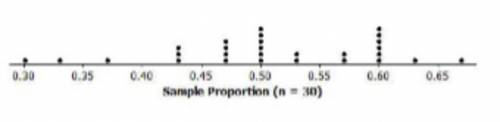
A group of eleventh graders wanted to estimate the population proportion of students in their high school who drink at least one soda per day. Each student selected a different random sample of students and calculated the proportion that drink at least one soda per day. The dot plot below shows the sampling distribution. This distribution has a mean of 0.51 and a standard deviation of 0.09. 1)What is your estimate for the proportion of all students who would report that they drink at least one soda per day? (The center of the distribution is what would be used for the population proportion)

Answers: 2


Other questions on the subject: Mathematics
Mathematics, 21.06.2019 18:30, 420420blazee
You were told that the amount of time lapsed between consecutive trades on the new york stock exchange followed a normal distribution with a mean of 15 seconds. you were also told that the probability that the time lapsed between two consecutive trades to fall between 16 to 17 seconds was 13%. the probability that the time lapsed between two consecutive trades would fall below 13 seconds was 7%. what is the probability that the time lapsed between two consecutive trades will be between 14 and 15 seconds?
Answers: 3
Mathematics, 22.06.2019 01:30, justsuz72p71a21
Given the functions, f(x) = 2x^2 - 1 and g(x) = 5x, find f(g(x)) and g(f(
Answers: 2
Mathematics, 22.06.2019 03:00, nanaflower321
Alocal hamburger shop sold a combined total of 601 hamburgers and cheeseburgers on friday. there were 51 more cheeseburgers sold than hamburgers. how many hamburgers were sold on friday? a local hamburger shop sold a combined total of hamburgers and cheeseburgers on friday. there were more cheeseburgers sold than hamburgers. how many hamburgers were sold on friday?
Answers: 1
You know the right answer?
A group of eleventh graders wanted to estimate the population proportion of students in their high s...
Questions in other subjects:

History, 28.01.2020 18:43
Mathematics, 28.01.2020 18:43

History, 28.01.2020 18:43


Computers and Technology, 28.01.2020 18:43


