
Mathematics, 13.05.2021 23:10 karenpazyuli
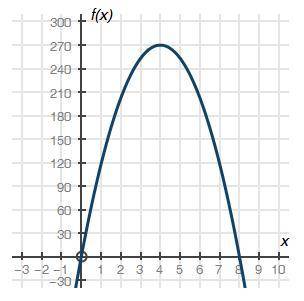
The graph below shows a company's profit f(x), in dollars, depending on the price of erasers x, in dollars, sold by the company:
Graph of quadratic function f of x having x intercepts at ordered pairs 0, 0 and 8, 0. The vertex is at 4, 270.
Part A: What do the x-intercepts and maximum value of the graph represent? What are the intervals where the function is increasing and decreasing, and what do they represent about the sale and profit? (4 points)
Part B: What is an approximate average rate of change of the graph from x = 1 to x = 4, and what does this rate represent? (3 points)
Part C: Describe the constraints of the domain. (3 points)

Answers: 2


Other questions on the subject: Mathematics
Mathematics, 21.06.2019 14:00, etxchrissy
Which graph represents the solution of the inequality?
Answers: 1
Mathematics, 21.06.2019 18:00, bobjill1609
The center of the circumscribed circle lies on line segment and the longest side of the triangle is equal to the of the circle.
Answers: 2
Mathematics, 21.06.2019 20:30, alannadiaz1
Two triangles can be formed with the given information. use the law of sines to solve the triangles. b = 49°, a = 16, b = 14
Answers: 3
Mathematics, 21.06.2019 23:00, keishadawson
Could someone me with this question i’ve been stuck on it for 20 minutes
Answers: 1
You know the right answer?
The graph below shows a company's profit f(x), in dollars, depending on the price of erasers x, in d...
Questions in other subjects:

Advanced Placement (AP), 06.02.2021 08:00
Mathematics, 06.02.2021 08:00

Chemistry, 06.02.2021 08:00
Mathematics, 06.02.2021 08:00

Mathematics, 06.02.2021 08:00
Mathematics, 06.02.2021 08:00


