What is the best description of the data?
Height Tally Frequency
65" | 1
66" | 1
...

Mathematics, 13.05.2021 21:20 pk4mk
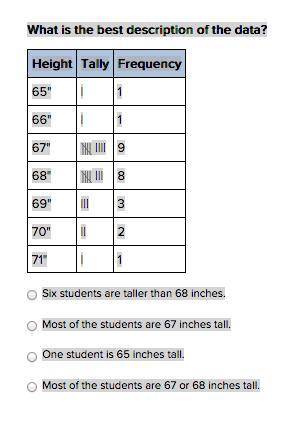
What is the best description of the data?
Height Tally Frequency
65" | 1
66" | 1
67" | 9
68" ||| 8
69" ||| 3
70" || 2
71" | 1
Six students are taller than 68 inches.
Most of the students are 67 inches tall.
One student is 65 inches tall.
Most of the students are 67 or 68 inches tall.

Answers: 1


Other questions on the subject: Mathematics
Mathematics, 21.06.2019 15:40, Prettygirlbuggy
Two parallel lines are crossed by a transversal. what is the value of x? x = 40 x = 70 x = 110 x = 130
Answers: 2
Mathematics, 21.06.2019 21:10, koolgurl2003
Starting at home, emily traveled uphill to the hardware store for 606060 minutes at just 666 mph. she then traveled back home along the same path downhill at a speed of 121212 mph. what is her average speed for the entire trip from home to the hardware store and back?
Answers: 1
Mathematics, 21.06.2019 23:10, izzynikkie
Which graph represents the linear function below? y-4= (4/3)(x-2)
Answers: 2
Mathematics, 21.06.2019 23:20, ajbrock1004
In a small section of a stadium there are 40 spectators watching a game between the cook islands and fiji. they all support at least one of the two teams. 25 spectators support the cook islands and 16 of these support both teams. how many support only fiji?
Answers: 2
You know the right answer?
Questions in other subjects:

Mathematics, 09.06.2021 01:40
Mathematics, 09.06.2021 01:40


Social Studies, 09.06.2021 01:40

Chemistry, 09.06.2021 01:40

History, 09.06.2021 01:40


