
Mathematics, 13.05.2021 19:20 csterner101
Use the graph below for this question:
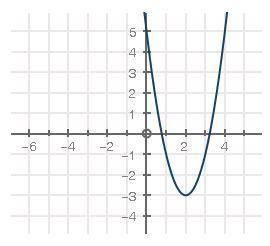
graph of parabola going through 2, negative 3 and 3, negative 1.
What is the average rate of change from x = 2 to x = 3? (1 point)
2
3
0
5

Answers: 2


Other questions on the subject: Mathematics
Mathematics, 21.06.2019 13:30, 22justinmcminn
Which equation represents a proportional relationship that has a constant of proportionality equal to 1/5
Answers: 1
Mathematics, 21.06.2019 21:30, madisonsimmons1120
Mon wants to make 5 lbs of the sugar syrup. how much water and how much sugar does he need… …to make 5% syrup?
Answers: 2
You know the right answer?
Use the graph below for this question:
graph of parabola going through 2, negative 3 and 3, negativ...
Questions in other subjects:
Mathematics, 19.07.2021 17:10
Mathematics, 19.07.2021 17:10
Mathematics, 19.07.2021 17:10
Mathematics, 19.07.2021 17:10

Mathematics, 19.07.2021 17:10


Geography, 19.07.2021 17:10


