GEOMETRY: ANNUAL SALARIES AND GENDER (PERFORMANCE TASK)
⬛️ STEP 1: ⬛️
◉ . Use the regr...

Mathematics, 13.05.2021 14:20 jacamron
GEOMETRY: ANNUAL SALARIES AND GENDER (PERFORMANCE TASK)
⬛️ STEP 1: ⬛️
◉ . Use the regression calculator or another tool of your choice to
create a scatter plot of the data for men, where the independent variable
is the year since 2000 and the dependent variable is the number of
people (in thousands). Take a screenshot of your scatterplot and paste it
below. If your graph does not include labels, then include a description of
what the axes represent.
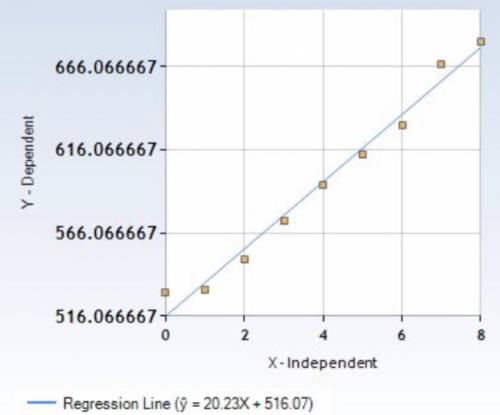
➜ (Graph #1).
➜ The x axis represents the number of years since the year
2000 while the y axis represents the number of US citizens
who got a bachelor's degree that year. Note that the number
of US citizens is in thousands.
◉ . Use your calculator to find the regression line y = mx + b for men
where x is the number of years since 2000 and y is the number of men.
Complete the regression equation below.
M(x) =
➜ 20.23x + 516.07.
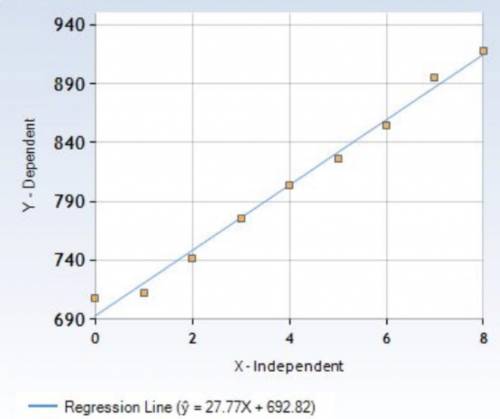
◉ . Repeat the above steps with the data for women.
Insert a screenshot of the scatterplot for women below.
➜ (Graph #2)
➜ The x axis represents the number of years since the year
2000 while the y axis represents the number of US citizens
who got a bachelor's degree that year. Note that the number
of US citizens is in thousands.
Complete the regression equation below.
F(x) =
➜ 28.67x + 685.99.
⬛️ STEP 2: ⬛️
◉ . Often, social changes, such as education trends, show linear
relationships. How well does a linear model fit the data in this problem?
Justify your answer in terms of the scatterplots and in terms of the data
that the regression calculator gives.
➜ Both have a positive correlation, because they are close to
one. These being 0.983 and 0.991 which are both very close
to 1.
◉ . Using proper units, state the slopes for the functions M and F.
➜ Slope of : 20.233.
➜ Slope of : 28.687.
◉ . Explain what these slopes represent in terms of Americans earning
bachelor degrees.
➜ The slopes represent a greater increase to the amount of
women getting bachelors degrees to men. The slope shows
us that this gap continues to rise.
⬛️ STEP 3: ⬛️
◉ . The functions M and F form a system of linear equations. Use your
graphing calculator to find the solutions to this system graphically. Insert
a screenshot of your graph below.
➜ (Graph #3).
◉ . The solution of the system is:
➜ (-20.12 , 108.96).
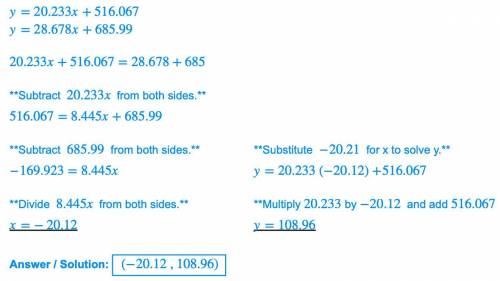
◉ . Solve the system again using any algebraic method, such as
substitution or elimination. Show your work step-by-step with clear
notation. Make sure your answer matches the answer you found in the
previous problem.
➜ (Picture #4: step-by-step solving).
◉ . Interpret the solution to the system in terms of Americans earning
bachelor degrees. Recall the opening paragraph: “In the early 1980s,
women first started to outnumber men in college enrollment. Since the
mid-1990s, women have earned more bachelor degrees than men.” State
whether or not you think your results from Steps 3a-3c support the
opening paragraph. Justify your reasoning. If the results do not support it,
explain why this might be.
➜ The solution supports the opening paragraph. When
looking at the graph it shows that in the 1980’s women
started outnumbering men and that gap has increased since
then. The numbers support this because -20 refers to 20
years ago as of 2020 which is 1980.
⬛️ STEP 4: ⬛️
◉ . Use the models for M and F to predict the number of degrees that
will be earned by men and women in the year 2015.
➜ The number of degrees earned by men = 819.
➜ The number of degrees earned by women = 1,116.


Answers: 3


Other questions on the subject: Mathematics
Mathematics, 21.06.2019 16:30, safiyabrowne7286
How do you summarize data in a two-way frequency table?
Answers: 3
Mathematics, 21.06.2019 18:30, george6871
Abus travels 36 miles in 45 minutes. enter the number of miles the bus travels in 60 minutes at this rate.
Answers: 2
Mathematics, 22.06.2019 00:00, isabellecannuli
Margaret is purchasing a house for $210,000 with a 15 year fixed rate mortgage at 4.75% interest she has made a 5% down payment the house is valued at 205,000 and the local tax rate is 3.5% homeowners insurance 600 per year what are her total monthly payment
Answers: 1
Mathematics, 22.06.2019 03:30, jarrettashlyn
Which lines are parallel? justify your answer. lines p and q are parallel because same side interior angles are congruent. lines p and q are parallel because alternate exterior angles are congruent lines l and m are parallel because same side interior angles are supplementary lines l and m are parallel because alternate interior angles are supplementary.
Answers: 2
You know the right answer?
Questions in other subjects:
Mathematics, 09.07.2021 17:30

Biology, 09.07.2021 17:30

Mathematics, 09.07.2021 17:30

Mathematics, 09.07.2021 17:30


