
Mathematics, 13.05.2021 07:10 RogueDragon707
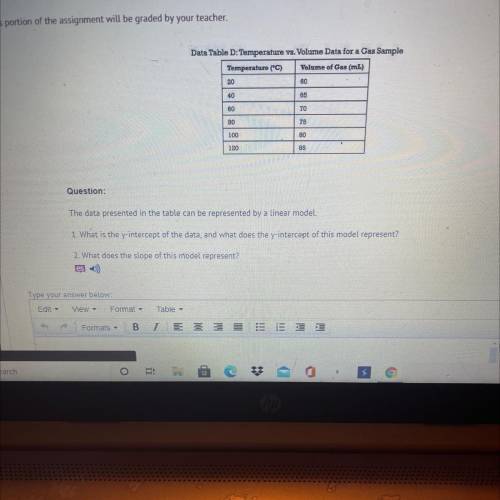
Data Table D: Temperature vs. Volume Data for a Gas Sample
Temperature (°C) Volume of Gas (mL)
20
60
40
65
60
70
80
75
100
80
120
85
Question:
The data presented in the table can be represented by a linear model.
1. What is the y-intercept of the data and what does the y-intercept of this model represent?
2. What does the slope of this model represent?

Answers: 1


Other questions on the subject: Mathematics
Mathematics, 21.06.2019 23:10, danielacortevpe3i66
12 3 4 5 6 7 8 9 10time remaining01: 24: 54which graph represents this system? y=1/2x + 3 y= 3/2x -1
Answers: 1
Mathematics, 22.06.2019 01:00, jayjay9434
70 points ! pls 2. given the following two sets of data what is the union of the two sets and what is the intersection of the two sets. set a = {1, 2, 3, 4, 5, 6, 7, 8, 9} set b = {2, 4, 6, 8, 10, 12, 14} 3. given a regular deck of cards. describe a way of pulling cards that would create a dependent event and then one that would create an independent event. 4. what is the probability of drawing a red card and then drawing a spade without replacing the card that was drawn first?
Answers: 1
Mathematics, 22.06.2019 03:30, jonathanrgarcia
Mr. piper is driving peter, roddy, and scott home from school. all of them want to ride in the front seat. how can he make a fair decision about who rides in the front seat?
Answers: 1
You know the right answer?
Data Table D: Temperature vs. Volume Data for a Gas Sample
Temperature (°C) Volume of Gas (mL)
Questions in other subjects:

Mathematics, 23.02.2022 06:00

English, 23.02.2022 06:00


SAT, 23.02.2022 06:00


