
Mathematics, 13.05.2021 05:40 nananna90
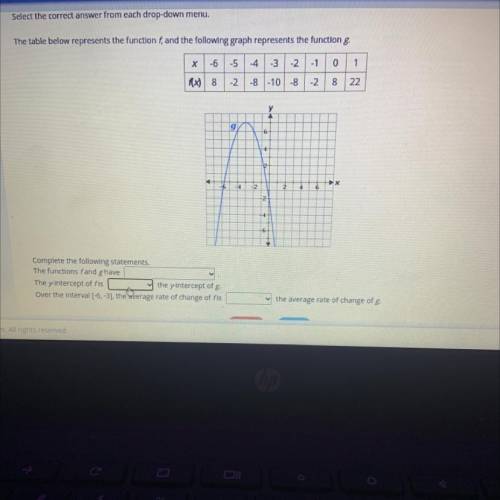
The table below represents the function f, and the following graph represents the function g.
-6
-5
-4
-3
-2
-1
0
1
& *
00
-2
-8
-10
-8
-2
8.
22
у
A
g)
16
12
X
6
-14
2.
2
6
2
Complete the following statements.
The functions fand g have
The y-intercept of fis
the y-Intercept of g.
Over the interval [-6, -3), the average rate of change of fis
the average rate of change of g.
No

Answers: 1


Other questions on the subject: Mathematics
Mathematics, 21.06.2019 18:00, WonTonBagel
You paid 28.00 for 8 gallons of gasoline. how much would you pay for 15 gallons of gasoline?
Answers: 1
Mathematics, 21.06.2019 18:00, justijust500
Ijust need to see how to do this. so you don’t have to answer all of them just a step by step explanation of one.
Answers: 3
Mathematics, 21.06.2019 18:30, issagirl05
Find the exact value of each of the following. in each case, show your work and explain the steps you take to find the value. (a) sin 17π/6 (b) tan 13π/4 (c) sec 11π/3
Answers: 2
You know the right answer?
The table below represents the function f, and the following graph represents the function g.
-6
Questions in other subjects:


Mathematics, 29.11.2020 14:40

Physics, 29.11.2020 14:40
Mathematics, 29.11.2020 14:40
Mathematics, 29.11.2020 14:40


