This dot plot is not symmetric, and the data set has two
extreme values.
Which of these...

Mathematics, 13.05.2021 04:10 youngsavage10120
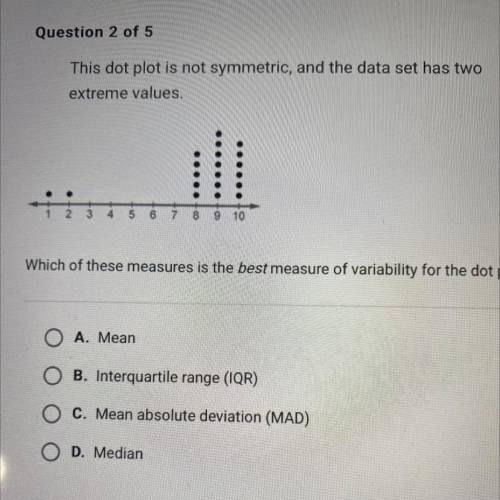
This dot plot is not symmetric, and the data set has two
extreme values.
Which of these measures is the best measure of variability for the dot plot?
A. Mean
B. Interquartile range (IQR)
C. Mean absolute deviation (MAD)
D. Median

Answers: 1


Other questions on the subject: Mathematics
Mathematics, 21.06.2019 15:30, hejdiidid9311
Will used 20 colored tiles to make a design in art class. 5/20 of his tiles were red. what is an equivalent fraction for the red tiles?
Answers: 1
Mathematics, 21.06.2019 22:00, LilFabeOMM5889
In δabc, m∠acb = 90°, cd ⊥ ab and m∠acd = 45°. find: a find cd, if bc = 3 in
Answers: 1
You know the right answer?
Questions in other subjects:

History, 20.08.2021 21:10
History, 20.08.2021 21:10
Mathematics, 20.08.2021 21:10

History, 20.08.2021 21:10
Mathematics, 20.08.2021 21:10


