
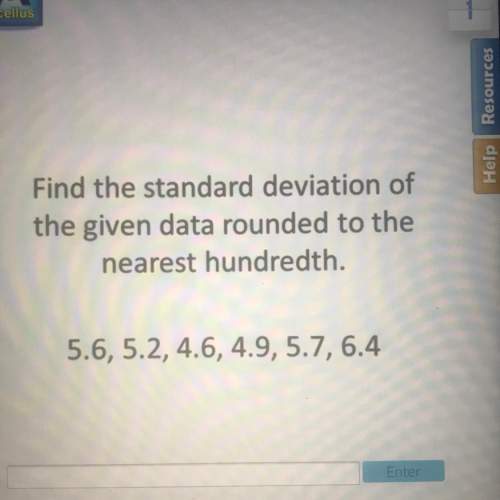
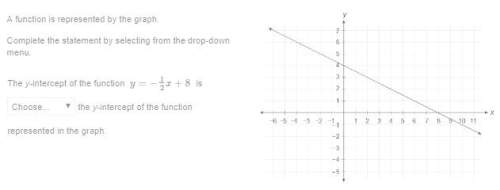
Mathematics, 13.05.2021 01:00 kell22wolf
Type the correct answer in each box. Use numerals instead of words.
The graph below shows the number of listeners who have heard a new single from a popular recording artist over the hours since the song was released.
The curve of best fit to model the data is given below.
Use the exponential model to complete the following statements. Round to the nearest whole number, if necessary.
There were
listeners when the song was released.
The approximate number of listeners who had heard the song after the hour 5 was
.
The number of listeners was about 29,458 after hour
.

Answers: 1


Other questions on the subject: Mathematics
Mathematics, 21.06.2019 23:30, allisonlillian
The product of sin 30 degrees and sin 60 degrees is same as the product of
Answers: 1
Mathematics, 22.06.2019 00:30, cgonzalez1371
Find the area of just the wood portion of the frame. this is called a composite figure. you will need to use your values from problem #2need all exepct 4 answerd if you can
Answers: 1
Mathematics, 22.06.2019 02:00, lexhoangg
Now, martin can reasonably guess that the standard deviation for the entire population of people at the mall during the time of the survey is $1.50. what is the 95% confidence interval about the sample mean? interpret what this means in the context of the situation where 95 people were surveyed and the sample mean is $8. use the information in this resource to construct the confidence interval.
Answers: 3
You know the right answer?
Type the correct answer in each box. Use numerals instead of words.
The graph below shows the numbe...
Questions in other subjects:
Mathematics, 21.10.2020 03:01


Mathematics, 21.10.2020 03:01


