
Mathematics, 12.05.2021 20:10 Laydax1587
PLEASE PLEASE HELP
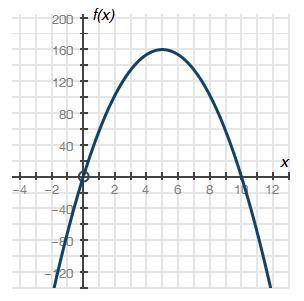
The graph below shows a company's profit f(x), in dollars, depending on the price of pencils x, in dollars, sold by the company:
Graph is below!!
Graph of quadratic function f of x having x intercepts at ordered pairs negative 0, 0 and 10, 0. The vertex is at 5, 160.
Part A: What do the x-intercepts and maximum value of the graph represent? What are the intervals where the function is increasing and decreasing, and what do they represent about the sale and profit? (4 points)
Part B: What is an approximate average rate of change of the graph from x = 2 to x = 5, and what does this rate represent? (3 points)
Part C: Describe the constraints of the domain. (3 points)

Answers: 3


Other questions on the subject: Mathematics
Mathematics, 21.06.2019 14:00, ninaaforever
Alawn mower manufacturer incurs a total of 34,816 in overhead costs and 388 per lawn mower in production costs. how many lawn mowers were manufactured if the average cost of productions is 660
Answers: 3
Mathematics, 21.06.2019 21:00, morganpl415
Eliza wants to make $10,000 from her investments. she finds an investment account that earns 4.5% interest. she decides to deposit $2,500 into an account. how much money will be in her account after 14 years?
Answers: 1
You know the right answer?
PLEASE PLEASE HELP
The graph below shows a company's profit f(x), in dollars, depending on the pric...
Questions in other subjects:

History, 02.07.2019 20:50

English, 02.07.2019 20:50
History, 02.07.2019 20:50
Mathematics, 02.07.2019 20:50

Biology, 02.07.2019 20:50
Mathematics, 02.07.2019 20:50


