1. The table shows the minimum wage rates for the United States during different years.
Year
...

Mathematics, 12.05.2021 17:20 madgiemiller2309
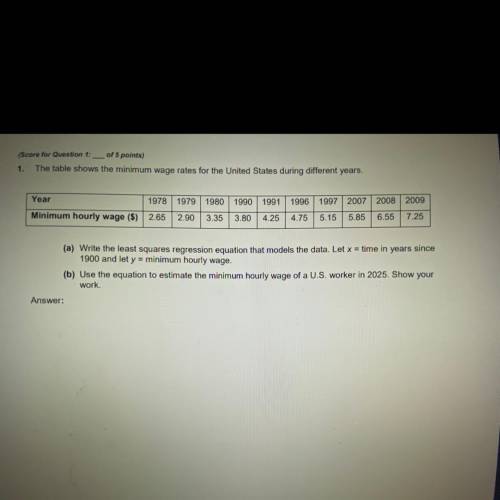
1. The table shows the minimum wage rates for the United States during different years.
Year
1978 1979 1980 1990 1991 1996 1997 2007 2008 2009
Minimum hourly wage ($) 2.65 2.90 3.35 3.80 4.25 4.75 5.15 5.85 6.55 7.25
(a) Write the least squares regression equation that models the data. Let x = time in years since
1900 and let y = minimum hourly wage.
(b) Use the equation to estimate the minimum hourly wage of a U. S. worker in 2025. Show your
work.

Answers: 3


Other questions on the subject: Mathematics
Mathematics, 21.06.2019 16:30, GalaxyWolf1895
An automated water dispenser fills packets with one liter of water on average, with a standard deviation of 5 milliliter. the manual says that after a year of operation the dispenser should be tested to see if it needs recalibration. a year later a number of filled packets are set aside and measured separately. it is found that the average packet now contains about 0.995 liters. does the dispenser need calibration? explain your answer.
Answers: 2
Mathematics, 21.06.2019 20:20, leximae2186
Consider the following estimates from the early 2010s of shares of income to each group. country poorest 40% next 30% richest 30% bolivia 10 25 65 chile 10 20 70 uruguay 20 30 50 1.) using the 4-point curved line drawing tool, plot the lorenz curve for bolivia. properly label your curve. 2.) using the 4-point curved line drawing tool, plot the lorenz curve for uruguay. properly label your curve.
Answers: 2
Mathematics, 22.06.2019 01:00, myasiaspencer
If log(a) = 1.2 and log(b)= 5.6, what is log(a/b)? a. 4.4b. 6.8c. not enough informationd. -4.4
Answers: 1
You know the right answer?
Questions in other subjects:

Medicine, 24.11.2020 21:40
Mathematics, 24.11.2020 21:40

Chemistry, 24.11.2020 21:40


Advanced Placement (AP), 24.11.2020 21:40
Mathematics, 24.11.2020 21:40


Mathematics, 24.11.2020 21:40

English, 24.11.2020 21:40


