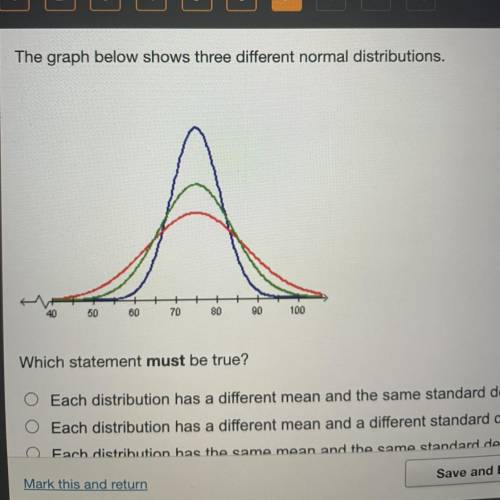
The graph below shows three different normal distributions.
50
60
70
80
90<...

Mathematics, 12.05.2021 02:40 jenaycasmall
The graph below shows three different normal distributions.
50
60
70
80
90
100
Which statement must be true?
O Each distribution has a different mean and the same standard deviation.
O Each distribution has a different mean and a different standard deviation.
O Fach distribution has the same mean and the same standard deviation

Answers: 1


Other questions on the subject: Mathematics
Mathematics, 21.06.2019 20:10, kingdrew27
Acolony contains 1500 bacteria. the population increases at a rate of 115% each hour. if x represents the number of hours elapsed, which function represents the scenario? f(x) = 1500(1.15)" f(x) = 1500(115) f(x) = 1500(2.15) f(x) = 1500(215)
Answers: 3
Mathematics, 21.06.2019 21:30, hailey200127
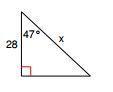
A. s.a.! similarity in right triangles, refer to the figure to complete this proportionc/a = a/? a.) cb.) hc.) rd.) s
Answers: 1
Mathematics, 21.06.2019 23:30, zaymuney3063
Which term applies to agb and dge? a. obtuse b. supplementary c. complementary d. vertical
Answers: 1
Mathematics, 22.06.2019 00:20, smooth5471
Three students, javier, sam, and corrine, participated in a fundraiser where people donated a certain amount of money per lap that the student ran. each student also had some initial donations that were collected before the run. the equations that represent each student's total donation, y, based on the number of laps ran, x, is shown below. match each equation with the correct rate of change for that student.
Answers: 1
You know the right answer?
Questions in other subjects:
Mathematics, 08.04.2021 04:30


Mathematics, 08.04.2021 04:30


Social Studies, 08.04.2021 04:30
Mathematics, 08.04.2021 04:30


