Which values should you plot to show a linear relationship?
Year
Log(population)
Popula...

Mathematics, 12.05.2021 01:50 ellareynolds2337
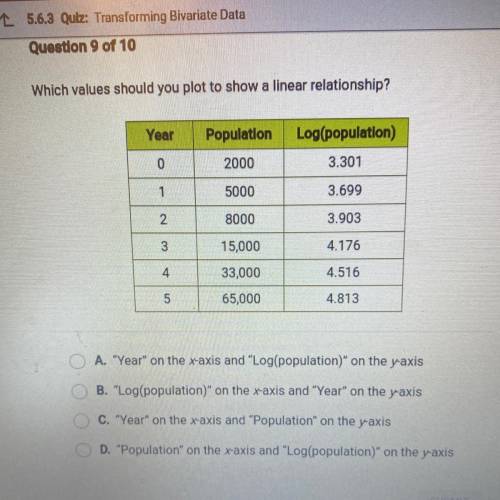
Which values should you plot to show a linear relationship?
Year
Log(population)
Population
2000
0
3.301
1
5000
3.699
2
8000
3.903
3
15,000
4.176
4
33,000
4.516
5
65,000
4.813
O A. "Year" on the x-axis and "Log(population)" on the yaxis
B. "Log(population)" on the x-axis and "Year" on the yaxis
C. "Year" on the x-axis and "Population" on the yaxis
D. "Population" on the x-axis and "Log(population)" on the y-axis

Answers: 3


Other questions on the subject: Mathematics
Mathematics, 21.06.2019 16:30, sydthekid9044
Divide the following fractions 3/4 ÷ 2/3 1/2 8/9 9/8 2
Answers: 2
Mathematics, 21.06.2019 17:30, margaret1758
Use the distributive law to multiply. 3(4x + 5y + 6)
Answers: 2
Mathematics, 21.06.2019 23:00, miahbaby2003p2af1b
Prove that 16^4-2^13-4^5 is divisible by 11.
Answers: 1
You know the right answer?
Questions in other subjects:
Mathematics, 13.02.2021 05:50

Physics, 13.02.2021 05:50

Business, 13.02.2021 05:50
Mathematics, 13.02.2021 05:50

Social Studies, 13.02.2021 05:50


