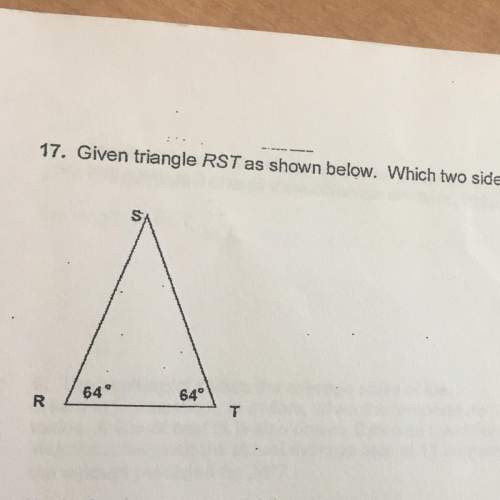
Which of the following inequalities defines the graph below?
...

Mathematics, 11.05.2021 23:10 itzia00
Which of the following inequalities defines the graph below?


Answers: 2


Other questions on the subject: Mathematics

Mathematics, 21.06.2019 13:30, sara24starling
Find the x-intercept and y-intercept of the line. 3x + 5y = −15
Answers: 1

Mathematics, 21.06.2019 14:00, kah36
When drawing a trend line for a series of data on a scatter plot, which of the following is true? a. there should be an equal number of data points on either side of the trend line. b. all the data points should lie on one side of the trend line. c. the trend line should not intersect any data point on the plot. d. the trend line must connect each data point on the plot.
Answers: 2

Mathematics, 21.06.2019 17:00, evelynnn452
Ataxi company charges $2.25 for the first mile and then $0.20 per mile for each additional mile, or f = $2.25 + $0.20(m - 1) where f is the fare and m is the number of miles. if juan's taxi fare was $6.05, how many miles did he travel in the taxi? if juan's taxi fare was 7.65, how many miles did he travel in taxi
Answers: 1

Mathematics, 21.06.2019 17:30, babygirl226
Select the correct answer from the drop-down menu. subtracting 3xy^2 from 8xy^2 gives the same result as the expression. [tex]3xy ^{2} - 8xy ^{2} [/tex][tex] { - 7xy}^{2} - {2xy}^{2} [/tex][tex] {7xy}^{2} - {2xy}^{2} [/tex]
Answers: 3
You know the right answer?
Questions in other subjects:

Mathematics, 10.06.2020 01:57

Mathematics, 10.06.2020 01:57


English, 10.06.2020 01:57


History, 10.06.2020 01:57


