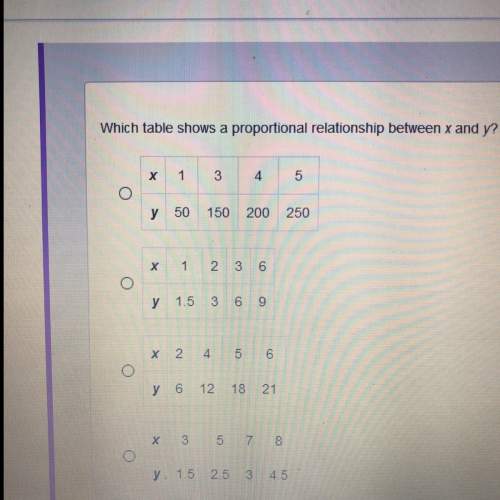
Here is the histogram of a data distribution. All class widths are 1.
4
3-
2
1 -<...

Mathematics, 11.05.2021 19:00 dunayahsu
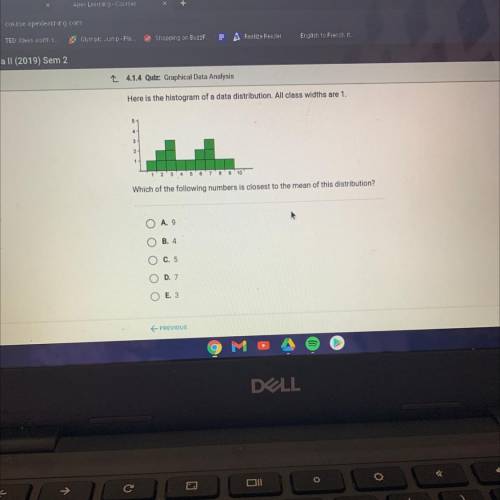
Here is the histogram of a data distribution. All class widths are 1.
4
3-
2
1 -
2 3'4'5'6'7'8' 9'10
Which of the following numbers is closest to the mean of this distribution?
O
A. 9
B. 4
C. 5
D. 7
E. 3

Answers: 1


Other questions on the subject: Mathematics
Mathematics, 21.06.2019 19:00, datands
Acompany that manufactures and sells guitars made changes in their product range. from the start they had 20 models. then they reduced the number of models to 15. as a result, the company enjoyed a 10% increase in turnover. - how much did the stock level change? in (%)
Answers: 2
Mathematics, 21.06.2019 21:40, joeykyle05
Write the contrapositive of the conditional statement. determine whether the contrapositive is true or false. if it is false, find a counterexample. a converse statement is formed by exchanging the hypothesis and conclusion of the conditional. a) a non-converse statement is not formed by exchanging the hypothesis and conclusion of the conditional. true b) a statement not formed by exchanging the hypothesis and conclusion of the conditional is a converse statement. false; an inverse statement is not formed by exchanging the hypothesis and conclusion of the conditional. c) a non-converse statement is formed by exchanging the hypothesis and conclusion of the conditional. false; an inverse statement is formed by negating both the hypothesis and conclusion of the conditional. d) a statement not formed by exchanging the hypothesis and conclusion of the conditional is not a converse statement. true
Answers: 1
Mathematics, 22.06.2019 02:20, smelcher3900
There are two major tests of readiness for college: the act and the sat. act scores are reported on a scale from 1 to 36. the distribution of act scores in recent years has been roughly normal with mean µ = 20.9 and standard deviation s = 4.8. sat scores are reported on a scale from 400 to 1600. sat scores have been roughly normal with mean µ = 1026 and standard deviation s = 209. reports on a student's act or sat usually give the percentile as well as the actual score. the percentile is just the cumulative proportion stated as a percent: the percent of all scores that were lower than this one. tanya scores 1260 on the sat. what is her percentile (± 1)?
Answers: 1
You know the right answer?
Questions in other subjects:


Social Studies, 22.10.2019 17:00
History, 22.10.2019 17:00
History, 22.10.2019 17:00
Mathematics, 22.10.2019 17:00
History, 22.10.2019 17:00


