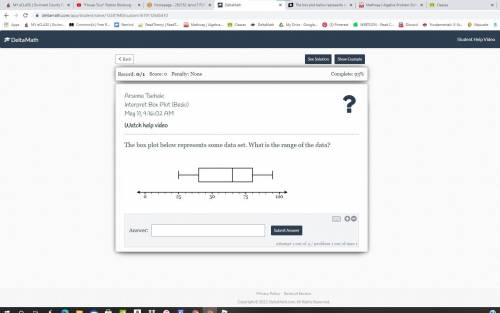
The box plot below represents some data set. What is the range of the data?
...

Mathematics, 11.05.2021 16:40 kenoknox
The box plot below represents some data set. What is the range of the data?

Answers: 3


Other questions on the subject: Mathematics
Mathematics, 21.06.2019 21:10, benallyadam2067
Hey free points ! people i have a few math questions on my profile consider looking at them i have to get done in 30 mins!
Answers: 1
Mathematics, 21.06.2019 23:40, Quidlord03
Which is the scale factor proportion for the enlargement shown?
Answers: 1
Mathematics, 22.06.2019 02:40, jake9919
Kilgore trout creates a new scale to diagnose depression. however, his scale only assesses one symptom of depression while ignoring others. which of the following is his new scale most likely lacking? a) test-retest reliability b) discriminant validity c) criterion validity d) alternate-forms reliability e) content validity f) none of the above
Answers: 1
Mathematics, 22.06.2019 03:00, thestarlexyp32wpj
The perimeter of ? cde is 55 cm. a rhombus dmfn is inscribed in this triangle so that vertices m, f, and n lie on the sides cd , ce , and de respectively. find cd and de if cf=8 cm and ef=12 cm. the answer is not cd=20 and de=15. i have tried that one, it does not work.
Answers: 3
You know the right answer?
Questions in other subjects:

English, 16.04.2020 06:21

English, 16.04.2020 06:21


