
Mathematics, 11.05.2021 05:30 bar23cardenine01
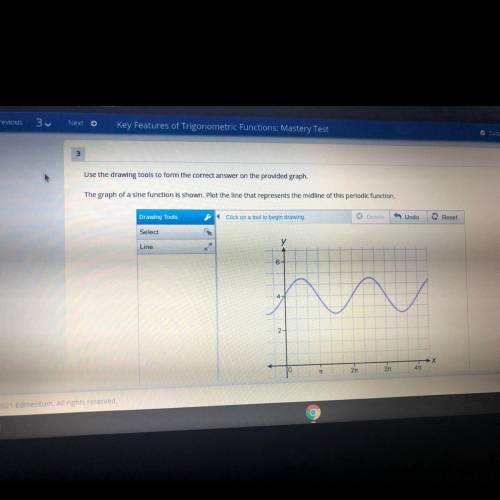
The graph of a sine function is shown. Plot the line that represents the midline of this periodic function.
Undo
Drawing Tools
X Delete
Reset
Click on a tool to begin drawing.
Select
у
Line
6-
w
2-
X
10
311
21t
TE
4T
Fights reserved

Answers: 3


Other questions on the subject: Mathematics
Mathematics, 21.06.2019 16:30, brysonsandridge69041
Diana is painting statues she has 7/8 of a liter of paint each statue requires 1/20 of a liter of paint how many statues can she paint?
Answers: 1
You know the right answer?
The graph of a sine function is shown. Plot the line that represents the midline of this periodic fu...
Questions in other subjects:


English, 21.10.2021 14:00

Mathematics, 21.10.2021 14:00

Chemistry, 21.10.2021 14:00
English, 21.10.2021 14:00
Biology, 21.10.2021 14:00


