B) The graph of y = x - 2x + 5 is
drawn on the axes on the left.
Use the graph to estimate th...

Mathematics, 10.05.2021 21:00 electrofy456
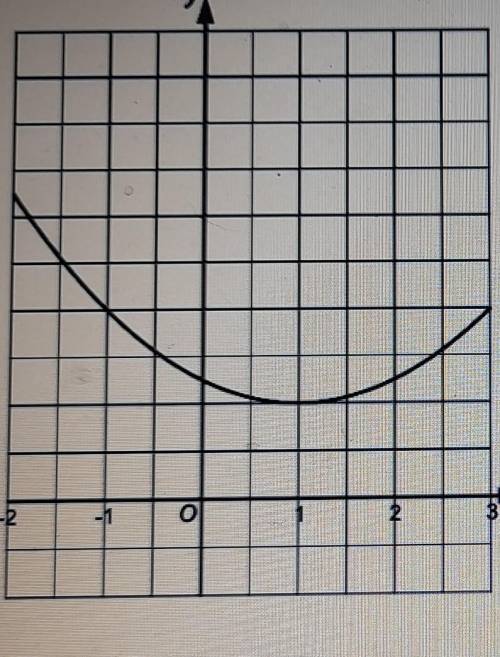
B) The graph of y = x - 2x + 5 is
drawn on the axes on the left.
Use the graph to estimate the
values of x when y= 6.
Give your answers to 1 decimal
place.

Answers: 3


Other questions on the subject: Mathematics
Mathematics, 21.06.2019 12:30, Tayannamorgan2373
Mercury poisoning is dangerous overload of mercury within the body. a major source of mercury within the body, a major source of mercury poisoning is consuming fish that contain mercury. certain fish are more prone to having higher levels of mercury than others. the pie chart shows the distribution of four breeds of fish at a hatchery. the hatchery has approximately 6,000 fish. a biologist from the centers for disease control and prevention randomly test 5% of each breed of fish for mercury content. her findings are shown in the following table. based on the biologist's findings, if a single salmon is randomly selected from those that were tested, what is the probability that this particular fish would have a dangerous mercury level? a) 0.001 b) 0.004 c) 0.02 d) 0.08
Answers: 1
Mathematics, 21.06.2019 18:30, Greekfreak
To determine the number of deer in a forest a forest ranger tags 280 and releases them back
Answers: 3
Mathematics, 21.06.2019 19:30, valerieaj113
Weekly wages at a certain factory are normally distributed with a mean of $400 and a standard deviation of $50. find the probability that a worker selected at random makes between $450 and $500
Answers: 2
Mathematics, 21.06.2019 22:10, willisanthony7815
Acompany manufactures three types of cabinets. it makes 110 cabinets each week. in the first week, the sum of the number of type-1 cabinets and twice the number of type-2 cabinets produced was 10 more than the number of type-3 cabinets produced. the next week, the number of type-1 cabinets produced was three times more than in the first week, no type-2 cabinets were produced, and the number of type-3 cabinets produced was the same as in the previous week.
Answers: 1
You know the right answer?
Questions in other subjects:


Mathematics, 23.07.2020 21:01


