
Mathematics, 10.05.2021 20:50 shanasia76
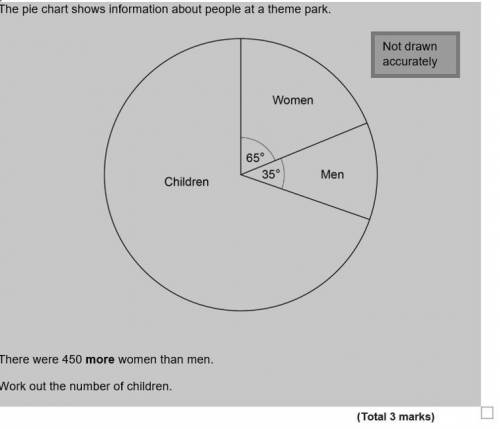
The pie chart shows information about people at a theme park.
There were 450 more women than men.
Work out the number of children.

Answers: 3


Other questions on the subject: Mathematics
Mathematics, 21.06.2019 18:00, mdlemuslopez
The graph shown is the graph of which function?
Answers: 2
Mathematics, 21.06.2019 18:30, Katlyndavis01
What is the answer to this question? i'm a bit stumped. also how do i do it? 5(x - 4) = 2(x + 5)
Answers: 1
You know the right answer?
The pie chart shows information about people at a theme park.
There were 450 more women than men.<...
Questions in other subjects:


English, 29.10.2020 18:40
Mathematics, 29.10.2020 18:40
English, 29.10.2020 18:40

Mathematics, 29.10.2020 18:40
Mathematics, 29.10.2020 18:40


