
Mathematics, 10.05.2021 20:40 jackchris2732
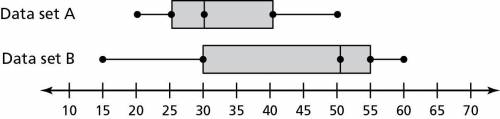
Two data sets contain an equal number of values. The double box-and-whisker plot represents the values in the data sets. Compare the data sets using measures of center and variation.
1 - Data set A has a greater measure of center, and Data set A has a greater measure of variation.
2 - Data set A has a greater measure of center, and Data set B has a greater measure of variation.
3 - Data set B has a greater measure of center, and Data set A has a greater measure of variation.
4 - Data set B has a greater measure of center, and Data set B has a greater measure of variation.

Answers: 1


Other questions on the subject: Mathematics
Mathematics, 21.06.2019 15:30, davidchafin59245
Planning for the possibility that your home might get struck by lighting and catch on fire is part of a plan for ?
Answers: 1
Mathematics, 21.06.2019 21:30, GOOBER3838
80 points suppose marcy made 45 posts online. if 23 of them contained an image, what percent of her posts had images? round your answer to the nearest whole percent. 54 percent 51 percent 49 percent 48 percent
Answers: 2
Mathematics, 21.06.2019 21:30, allendraven89pds755
Which equation is true? i. 56 ÷ 4·7 = 82 ÷ (11 + 5) ii. (24 ÷ 8 + 2)3 = (42 + 9)2 neither i nor ii ii only i and ii i only
Answers: 1
You know the right answer?
Two data sets contain an equal number of values. The double box-and-whisker plot represents the valu...
Questions in other subjects:
Mathematics, 04.02.2020 00:58

English, 04.02.2020 00:58
Mathematics, 04.02.2020 00:58
Mathematics, 04.02.2020 00:58

Mathematics, 04.02.2020 00:58
Mathematics, 04.02.2020 00:58

Geography, 04.02.2020 00:58


