
Mathematics, 10.05.2021 19:10 HTKPenguin
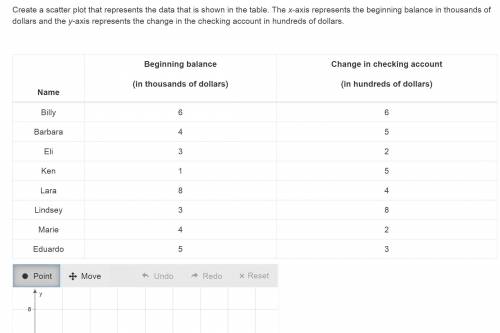
Eight people were asked what the balance of their checking account at the beginning of this past week was and how much it increased or decreased by the end of the week. Create a scatter plot that represents the data that is shown in the table. The x-axis represents the beginning balance in thousands of dollars and the y-axis represents the change in the checking account in hundreds of dollars.

Answers: 1


Other questions on the subject: Mathematics
Mathematics, 21.06.2019 15:30, fooligan3448
The local farm is advertising a special on fresh picked peaches. the farm charges $4.25 to pick your own peck of peaches and $3.50 for each additional peck you pick. write an equation for the total cost of peaches in terms of the number of pecks. deine your variables. how much does it cost to pick 3 pecks of peaches?
Answers: 3
You know the right answer?
Eight people were asked what the balance of their checking account at the beginning of this past wee...
Questions in other subjects:

Mathematics, 14.11.2019 01:31
Mathematics, 14.11.2019 01:31


Chemistry, 14.11.2019 01:31


