
Mathematics, 10.05.2021 15:20 dinadenoirefan
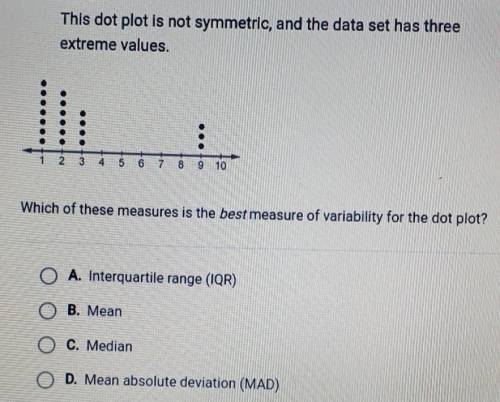
This dot plot is not symmetric, and the data set has three extreme values. Which of these measures is the best measure of variability for the dot plot? A. Interquartile range (IQR) B. Mean C. Median O D. Mean absolute deviation (MAD)

Answers: 1


Other questions on the subject: Mathematics
Mathematics, 21.06.2019 17:00, nihadsalim10
Find the roots of the equation below. x^2 - 6 + 9 = 0
Answers: 1
Mathematics, 21.06.2019 21:40, jacobasencio23
Use sigma notation to represent the following series for 9 terms.
Answers: 2
Mathematics, 22.06.2019 00:00, meganwintergirl
Can someone plz me understand how to do these. plz, show work. in exercises 1-4, rewrite the expression in rational exponent form.[tex]\sqrt[4]{625} \sqrt[3]{512} (\sqrt[5]{4} )³ (\sqrt[4]{15} )^{7}\\ (\sqrt[3]{27} )^{2}[/tex]
Answers: 3
You know the right answer?
This dot plot is not symmetric, and the data set has three extreme values.
Which of these measures...
Questions in other subjects:

Mathematics, 05.05.2020 11:24
Mathematics, 05.05.2020 11:24

Mathematics, 05.05.2020 11:24

Social Studies, 05.05.2020 11:24

Biology, 05.05.2020 11:24


