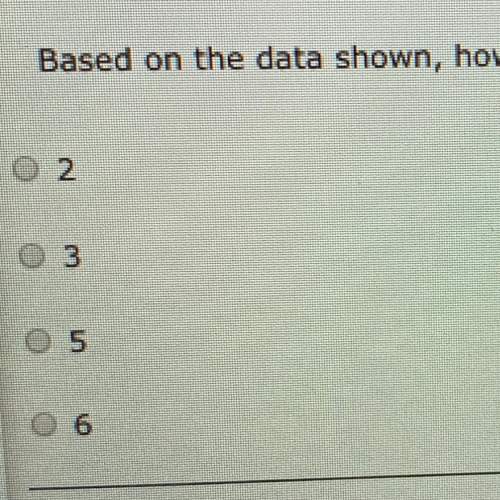
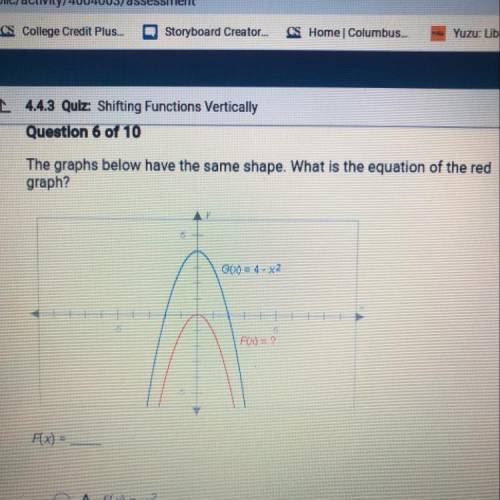
The graphs below have the same shape. What is the equation of the red
graph?
...

Mathematics, 09.05.2021 20:10 Buttercream16
The graphs below have the same shape. What is the equation of the red
graph?

Answers: 1


Other questions on the subject: Mathematics
Mathematics, 21.06.2019 20:20, bbyjoker
Recall that the owner of a local health food store recently started a new ad campaign to attract more business and wants to know if average daily sales have increased. historically average daily sales were approximately $2,700. the upper bound of the 95% range of likely sample means for this one-sided test is approximately $2,843.44. if the owner took a random sample of forty-five days and found that daily average sales were now $2,984, what can she conclude at the 95% confidence level?
Answers: 1
Mathematics, 21.06.2019 23:40, nightmarewade03
Determine the standard form of the equation of the line that passes through (-2,0) and (8,-5)
Answers: 1
You know the right answer?
Questions in other subjects:


Computers and Technology, 10.12.2020 01:00

Mathematics, 10.12.2020 01:00
English, 10.12.2020 01:00
Computers and Technology, 10.12.2020 01:00
Mathematics, 10.12.2020 01:00


