5

Mathematics, 07.05.2021 16:40 ArelysMarie
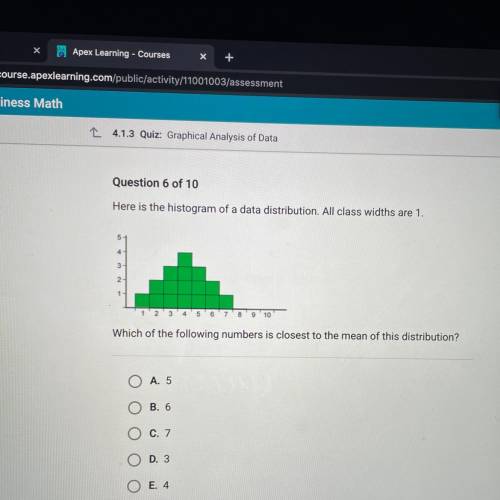
Question 6 of 10
Here is the histogram of a data distribution. All class widths are 1.
5
4
3
2
1
10
Which of the following numbers is closest to the mean of this distribution?
A. 5
o
B. 6
O
C. 7

Answers: 1


Other questions on the subject: Mathematics
Mathematics, 21.06.2019 13:30, rhiannonwheatcr6619
The graph shown below expresses a radical function that can be written in the form f(x)=a(x+k)1/n+c what does the graph tell you about the value of n in this function
Answers: 3
Mathematics, 21.06.2019 19:30, sk9600930
Sundar used linear combination to solve the system of equations shown. he did so by multiplying the first equation by 5 and the second equation by another number to eliminate the y-terms. what number did sundar multiply the second equation by? 2x+9y=41 3x+5y=36
Answers: 1
Mathematics, 21.06.2019 19:30, taylor511176
Celeste wants to have her hair cut and permed and also go to lunch. she knows she will need $50. the perm cost twice as much as her haircut and she needs $5 for lunch. how much does the perm cost?
Answers: 1
You know the right answer?
Question 6 of 10
Here is the histogram of a data distribution. All class widths are 1.
5
5
Questions in other subjects:

Biology, 03.10.2021 01:00

History, 03.10.2021 01:00
Mathematics, 03.10.2021 01:00

Business, 03.10.2021 01:00

Social Studies, 03.10.2021 01:00

Health, 03.10.2021 01:00


