
Mathematics, 07.05.2021 16:20 blacklifewed
Please help
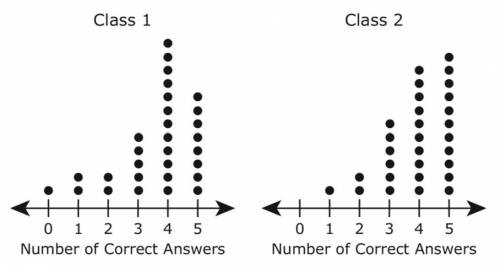
The dot plot show the number of correct answers students got in a 5-item warm up.
Which statement is best supported by the information in the dot plots?
The range of the data for Class 1 is less than the range of the data for Class 2.
The data for class 1 and the data for class 2 are skewed to the left.
The mode of the data for Class 1 is greater than the mode of the data for Class 2.
The median of the data for Class 1 is greater than the median of the data for Class 2.

Answers: 2


Other questions on the subject: Mathematics
Mathematics, 21.06.2019 18:30, chandranewlon
Agraphic designer created a logo on eight and a half by 11 inch paper. in order to be placed on a business card, the logo needs to be one and 7/10 inches by 2 and 1/5 in. what is the scale factor of the dilation
Answers: 1
Mathematics, 21.06.2019 19:00, Brendah4962
Solve the equation using the zero-product property. -3n(7n - 5) = 0 a. 0, -5/7 b. -1/3, -5/7 c. -1/3, 5/7 d. 0, 5/7
Answers: 2
Mathematics, 21.06.2019 20:00, aheadrick5163
Apatient is to be given 35 milligrams of demerol every 4 hours. you have demerol 50 milligrams/milliliter in stock. how many milliliters should be given per dose?
Answers: 2
You know the right answer?
Please help
The dot plot show the number of correct answers students got in a 5-item warm up.
Questions in other subjects:
Mathematics, 10.12.2020 01:00


History, 10.12.2020 01:00
Mathematics, 10.12.2020 01:00
Mathematics, 10.12.2020 01:00


