
Mathematics, 06.05.2021 23:20 butterflycc
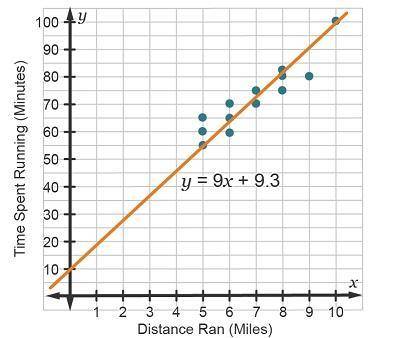
The data reflects the distance traveled (x), paired with time spent running (y).
How can the slope of the line be interpreted?
Every 9 minutes, an additional mile is traveled.
Every 9.3 minutes, an additional mile is traveled.
Each runner travels an average of 9.3 miles.
Each runner travels an average of 9 miles.

Answers: 2


Other questions on the subject: Mathematics
Mathematics, 21.06.2019 21:40, lineaeriksen
Ineed your ! i was to turn this into pond first thing i gotta do is outline the inside with this plastic how big should i cut the plastic the height: 10 1/2” the length: 40” the width: 12” me !
Answers: 1
Mathematics, 21.06.2019 23:00, Nathaliasmiles
Charlie tosses five coins. what is the probability that all five coins will land tails up.
Answers: 2
Mathematics, 22.06.2019 01:30, alyssaboosiefkes
Im so bad at fractions they are not my best math thing to work on
Answers: 3
You know the right answer?
The data reflects the distance traveled (x), paired with time spent running (y).
How can the slop...
Questions in other subjects:
Mathematics, 02.10.2020 14:01


Social Studies, 02.10.2020 14:01
Mathematics, 02.10.2020 14:01

Geography, 02.10.2020 14:01
Mathematics, 02.10.2020 14:01


