
Mathematics, 06.05.2021 21:00 joshtrice5879
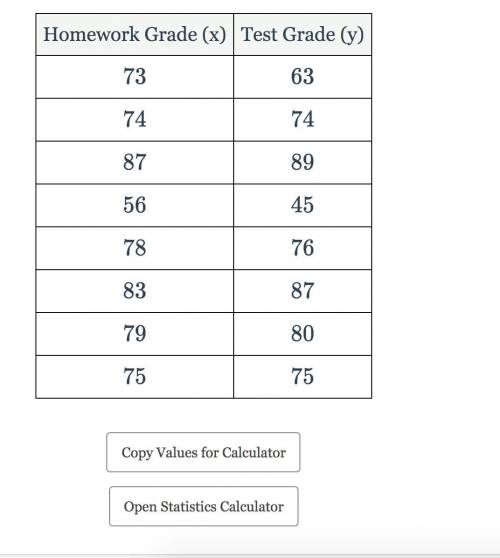
A mathematics teacher wanted to see the correlation between test scores and homework. The homework grade (x) and test grade (y) are given in the accompanying table. Write the linear regression equation that represents this set of data, rounding all coefficients to the nearest hundredth. Using this equation, find the projected test grade, to the nearest integer, for a student with a homework grade of 62.

Answers: 3


Other questions on the subject: Mathematics
Mathematics, 21.06.2019 19:30, Animallover100
Write the sine and cosine values of a, b, respectively, in the figure for (1) and (2) + explanation.
Answers: 1
Mathematics, 21.06.2019 21:00, feyundre52
Hurry if the population of of an ant hill doubles every 10 days and there are currently 100 ants living in the ant hill what will the ant population be in 20 days
Answers: 2
Mathematics, 21.06.2019 21:10, linettepizarro1233
See attachment below and find the equivalent of tan(∠qsr)
Answers: 3
Mathematics, 21.06.2019 22:00, natetheman7740
Given: △acm, m∠c=90°, cp ⊥ am , ac: cm=3: 4, mp-ap=1. find am.
Answers: 2
You know the right answer?
A mathematics teacher wanted to see the correlation between test scores and homework. The homework g...
Questions in other subjects:

Computers and Technology, 21.07.2019 07:50

History, 21.07.2019 07:50

English, 21.07.2019 07:50


Mathematics, 21.07.2019 07:50


