This dot plot is symmetric, and the data set has no
extreme values.
What is the best m...

Mathematics, 06.05.2021 19:20 andydiaz1227
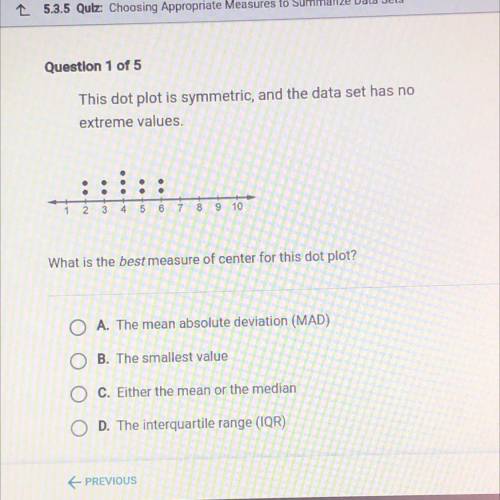
This dot plot is symmetric, and the data set has no
extreme values.
What is the best measure of center for this dot plot?
O A. The mean absolute deviation (MAD)
O B. The smallest value
O C. Either the mean or the median
D. The interquartile range (IQR)

Answers: 1


Other questions on the subject: Mathematics
Mathematics, 21.06.2019 16:30, RealGibbon857
The temperature of chicken soup is 192.7°f. as it cools, the temperature of the soup decreases 2.3°f per minute. what is the temperature in degrees fahrenheit of the soup after 25 minutes? a. 27.3°f b. 57.5°f c. 135.2°f d. 250.2°f
Answers: 1
Mathematics, 21.06.2019 17:50, AdanNava699
Find the cosine function that is represented in the graph.
Answers: 1
Mathematics, 21.06.2019 19:30, sk9600930
Sundar used linear combination to solve the system of equations shown. he did so by multiplying the first equation by 5 and the second equation by another number to eliminate the y-terms. what number did sundar multiply the second equation by? 2x+9y=41 3x+5y=36
Answers: 1
Mathematics, 21.06.2019 22:00, reesewaggoner8
Uestion 1(multiple choice worth 5 points) (05.02)alex wants to paint one side of his skateboard ramp with glow-in-the-dark paint, but he needs to know how much area he is painting. calculate the area of the isosceles trapezoid. isosceles trapezoid with top base 12 feet, bottom base of 18 feet, and height of 6 feet. 72 ft2 84 ft2 90 ft2 108 ft2
Answers: 1
You know the right answer?
Questions in other subjects:


Business, 31.07.2019 10:00

Biology, 31.07.2019 10:00

Social Studies, 31.07.2019 10:00
English, 31.07.2019 10:00


