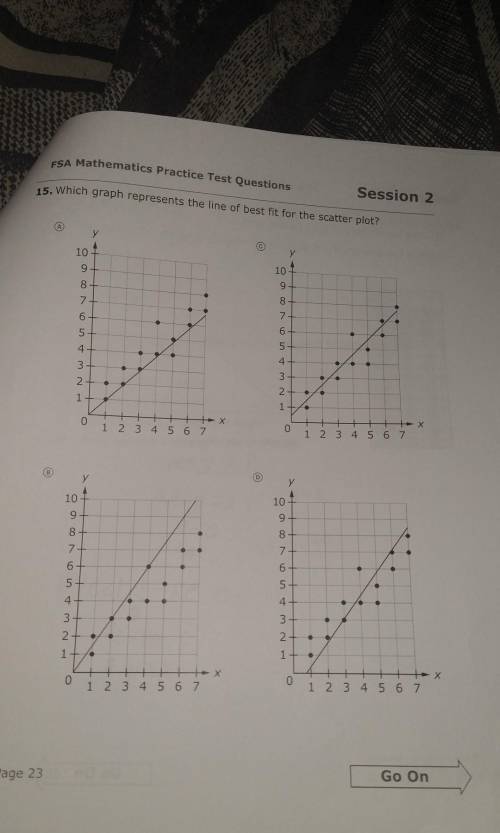
Which graph represents the line of best fit for the scatter plot??
...

Mathematics, 06.05.2021 04:20 mikeymanfs
Which graph represents the line of best fit for the scatter plot??

Answers: 3


Other questions on the subject: Mathematics
Mathematics, 21.06.2019 17:30, cecelia090
Any is very appreciated! (picture is provided below)not sure how to do this at all won't lie
Answers: 1
Mathematics, 21.06.2019 18:00, dizzleman3030
Find the perimeter of the figure shown above. a. 40 cm c. 52 cm b. 60 cm d. 75 cm select the best answer from the choices provided
Answers: 1
Mathematics, 22.06.2019 00:30, cassidyhead27
A10 inch cookie cake is divided into 8 slices. what is the area of 3 slices
Answers: 1
Mathematics, 22.06.2019 02:30, kyaslaven9791
The focus of a parabola is (-4,-5) and its directrix is y=-1 find the equation
Answers: 3
You know the right answer?
Questions in other subjects:
Mathematics, 26.10.2019 21:43

History, 26.10.2019 21:43


History, 26.10.2019 21:43
History, 26.10.2019 21:43

Mathematics, 26.10.2019 21:43
Biology, 26.10.2019 21:43


