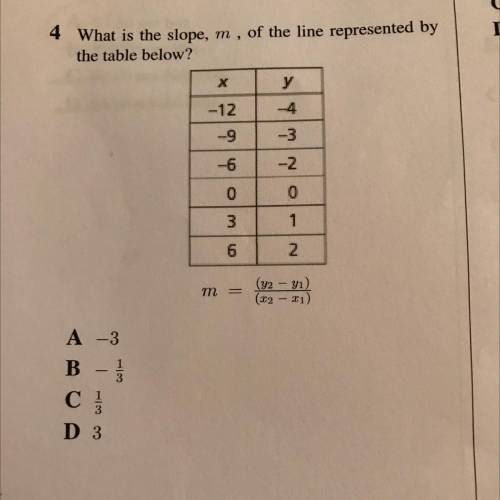
What is the slope, m, of the line represented by the table below?
A. -4
B. -1/3
C. 1/3...

Mathematics, 06.05.2021 03:10 gissellebramwell
What is the slope, m, of the line represented by the table below?
A. -4
B. -1/3
C. 1/3
D. 3

Answers: 1


Other questions on the subject: Mathematics
Mathematics, 22.06.2019 00:00, crazylogic963
Charlie is at an amusement park that has 18 different rides. each ride costs $1.75. the function c(r) = 1.75r represents the total amount of money that charlie will spend if he goes on r rides, but he never goes on the same one more than once. what domain and range are reasonable for the function?
Answers: 3
Mathematics, 22.06.2019 00:20, kaybec2386
Data for the height of a model rocket launch in the air over time are shown in the table. darryl predicted that the height of the rocket at 8 seconds would be about 93 meters. did darryl make a good prediction? yes, the data are best modeled by a quadratic function. the value of the function at 8 seconds is about 93 meters. yes, the data are best modeled by a linear function. the first differences are constant, so about 93 meters at 8 seconds is reasonable. no, the data are exponential. a better prediction is 150 meters. no, the data are best modeled by a cubic function. a better prediction is 100 meters.
Answers: 2
Mathematics, 22.06.2019 01:30, Falconpride4079
Drag the tiles to the correct boxes to complete the pairs. match the exponential functions with their horizontal asymptotes and y-intercepts. f(x) = 7x − 4 f(x) = 3x+2 + 4 f(x) = 9x+1 − 4 f(x) = 2x + 4 horizontal asymptote and y-intercept exponential function horizontal asymptote: y = 4 y-intercept: (0, 5) arrowboth horizontal asymptote: y = -4 y-intercept: (0, 5) arrowboth horizontal asymptote: y = -4 y-intercept: (0, -3) arrowboth horizontal asymptote: y = 4 y-intercept: (0, 13) arrowboth
Answers: 1
You know the right answer?
Questions in other subjects:
Mathematics, 01.04.2021 15:20

Physics, 01.04.2021 15:20


