
Mathematics, 05.05.2021 21:40 olorteguimikie
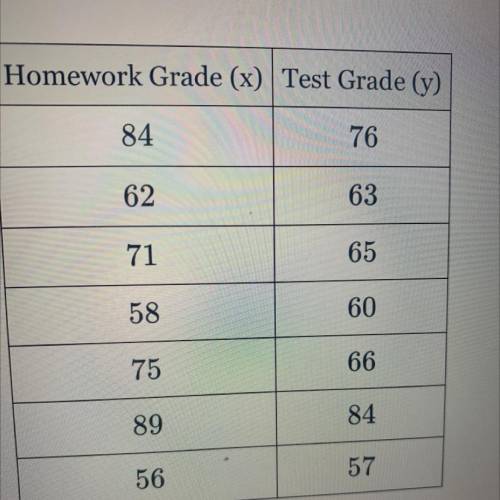
A mathematics teacher wanted to see the correlation between test scores and homework. The homework grade (x) and test grade (y) are given in the accompanying table. Write the linear regression equation that represents this set of data, rounding all coefficients to the nearest hundredth. Using this equation, find the projected test grade, to the nearest integer , for a student with a homework grade of 76.

Answers: 1


Other questions on the subject: Mathematics
Mathematics, 21.06.2019 17:10, ivilkas23
The frequency table shows a set of data collected by a doctor for adult patients who were diagnosed with a strain of influenza. patients with influenza age range number of sick patients 25 to 29 30 to 34 35 to 39 40 to 45 which dot plot could represent the same data as the frequency table? patients with flu
Answers: 2
Mathematics, 21.06.2019 20:30, marahkotelman
Arectangle has a width of 5 cm and a length of 10 cm. if the width is increased by 3, how does the perimeter change?
Answers: 1
Mathematics, 21.06.2019 23:10, ammarsico19
Tom travels between the two mile markers shown and then finds his average speed in miles per hour. select the three equations that represent this situation.
Answers: 1
You know the right answer?
A mathematics teacher wanted to see the correlation between test scores and homework. The homework g...
Questions in other subjects:

Chemistry, 16.11.2020 20:50
Mathematics, 16.11.2020 20:50
Mathematics, 16.11.2020 20:50
Mathematics, 16.11.2020 20:50

History, 16.11.2020 20:50
Mathematics, 16.11.2020 21:00


