Which of the following best describes the graph below?
A. It is not a function.
B. It is a m...

Mathematics, 05.05.2021 20:10 hwk4102
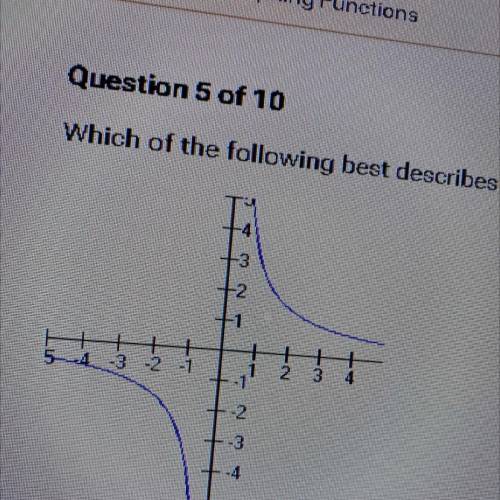
Which of the following best describes the graph below?
A. It is not a function.
B. It is a many-to-one function.
C. It is a one-to-one function.
D. It is a function, but it is not one-to-one.

Answers: 2


Other questions on the subject: Mathematics
Mathematics, 21.06.2019 20:30, 2022maldonadoleonel
Your friend uses c=50p to find the total cost, c, for the people, p, entering a local amusement park what is the unit rate and what does it represent in the context of the situation?
Answers: 2
Mathematics, 21.06.2019 22:30, izabelllreyes
Gabrielle's age is two times mikhail's age. the sum of their ages is 84. what is mikhail's age?
Answers: 2
You know the right answer?
Questions in other subjects:
Mathematics, 13.07.2019 22:00


Mathematics, 13.07.2019 22:00


