
Mathematics, 05.05.2021 18:20 surfergirlmymy
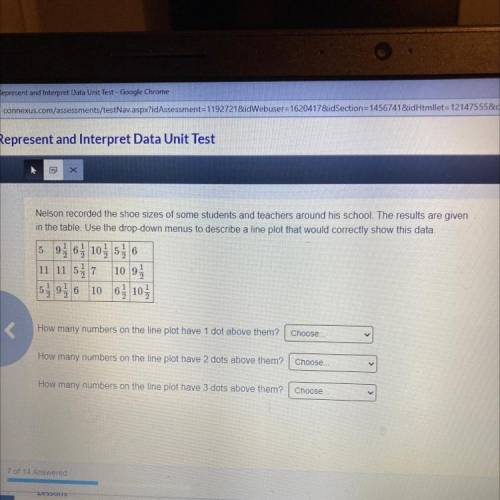
Nelson recorded the shoe sizes of some students and teachers around his school. The results are given
in the table. Use the drop-down menus to describe a line plot that would correctly show this data.
5 926 102 536
11 11 5 7 10 9
9
6 10 6 10
NI
2
2
How many numbers on the line plot have 1 dot above them? Choose
How many numbers on the line plot have 2 dots above them? Choose.
How many numbers on the line plot have 3 dots above them? Choose

Answers: 2


Other questions on the subject: Mathematics
Mathematics, 21.06.2019 14:00, jamaiciaw6
Algebra 1: unit 6 part 2 of test a) the table shows a linear function. x 0 1 2 3 5 13 21 29 37 45 53 (a) determine the difference of outputs of any two inputs that are 1 unit apart. show your work. (b) determine the difference of outputs of any two inputs that are 2 units apart. show your work.
Answers: 2
Mathematics, 21.06.2019 17:00, zamudioj92p80d12
Issof claims that the scale factor is 1/2. which statement about his claim is correct
Answers: 3
Mathematics, 21.06.2019 17:40, kayleeemerson77
The graph of h(x)= |x-10| +6 is shown. on which interval is this graph increasing
Answers: 2
Mathematics, 21.06.2019 22:20, KillerSteamcar
Which strategy is used by public health to reduce the incidence of food poisoning?
Answers: 2
You know the right answer?
Nelson recorded the shoe sizes of some students and teachers around his school. The results are give...
Questions in other subjects:


History, 18.12.2019 06:31
Mathematics, 18.12.2019 06:31

Biology, 18.12.2019 06:31

Mathematics, 18.12.2019 06:31


