
Mathematics, 05.05.2021 17:40 AsapYeff
HELP PLZ WILL GIVE 35 POINTS
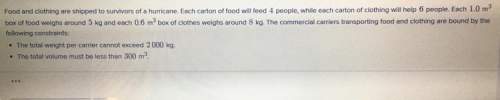
The graph below plots the values of y for different values of x:
plot the ordered pairs 1, 3 and 2, 4 and 3, 9 and 4, 7 and 5, 2 and 6, 18
What does a correlation coefficient of 0.25 say about this graph?
x and y have a strong, positive correlation
x and y have a weak, positive correlation
x and y have a strong, negative correlation
x and y have a weak, negative correlation

Answers: 1


Other questions on the subject: Mathematics
Mathematics, 21.06.2019 18:00, joshuahagerman1404
In triangle △abc, ∠abc=90°, bh is an altitude. find the missing lengths. ah=4 and hc=1, find bh.
Answers: 3
Mathematics, 21.06.2019 18:20, katlynnschmolke
What is the solution set of the quadratic inequality x2- 5< 0? o {xl-55x55{x- 155x55){xl -55x5 15){x1 - 15 sx5/5)
Answers: 2
Mathematics, 21.06.2019 23:30, maciemessing2
Drag each number to the correct location on the statements. not all numbers will be used. consider the sequence below. -34, -21, -8, 5, complete the recursively defined function to describe this sequence
Answers: 1
You know the right answer?
HELP PLZ WILL GIVE 35 POINTS
The graph below plots the values of y for different values of x:
Questions in other subjects:

Mathematics, 02.01.2022 22:30
Mathematics, 02.01.2022 22:30

Arts, 02.01.2022 22:30

Geography, 02.01.2022 22:30


Chemistry, 02.01.2022 22:30
Mathematics, 02.01.2022 22:30


