
Mathematics, 05.05.2021 07:30 jon3232
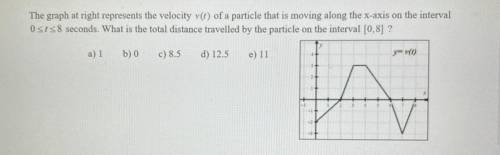
The graph at right represents the velocity v(t) of a particle that is moving along the x-axis on the interval
Osts 8 seconds. What is the total distance travelled by the particle on the interval [0,8] ?
a) 1
b) 0
c) 8.5
d) 12.5
e) 11
y=v(0)

Answers: 1


Other questions on the subject: Mathematics
Mathematics, 22.06.2019 01:30, gwoodbyrne
Study results indicate that the mean length of time people spend on a bus in a city is between 21.2 min and 24.5 min what is the study margin of the error?
Answers: 1
You know the right answer?
The graph at right represents the velocity v(t) of a particle that is moving along the x-axis on the...
Questions in other subjects:


Business, 01.10.2019 19:30


Mathematics, 01.10.2019 19:30
Mathematics, 01.10.2019 19:30


