
Mathematics, 05.05.2021 02:20 marieb39
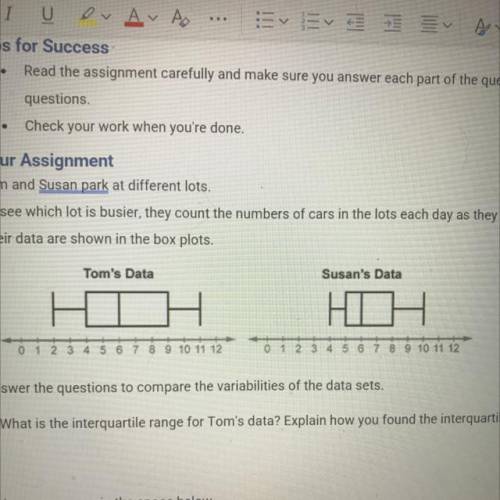
Tom and Susan’s Park at different lots. To see which lot is busier, they count the numbers of cars in the lot each day as they arrive. Their data are shown in the box plots.
Answer the questions to compare the variables of data sets.
1. What is the interquartile range of Tom’s data? Explain how you found the interquartile range.
2. What is the interquartile range for Susan‘s data?
3. Who’s data are more variable?

Answers: 1


Other questions on the subject: Mathematics
Mathematics, 21.06.2019 19:30, tigistamare03
Acabinmaker buys 3.5 liters of oat varnish the varnish cost $4.95 per liter what is the total cost of 3.5 liters
Answers: 1
Mathematics, 21.06.2019 22:30, muziqbox594
What is the name of a polygon that has four congruent sides and theses angle measures 60,120,60,120?
Answers: 1
You know the right answer?
Tom and Susan’s Park at different lots. To see which lot is busier, they count the numbers of cars i...
Questions in other subjects:


History, 24.08.2019 05:00

Mathematics, 24.08.2019 05:00


