
Mathematics, 04.05.2021 17:40 kedjenpierrelouis
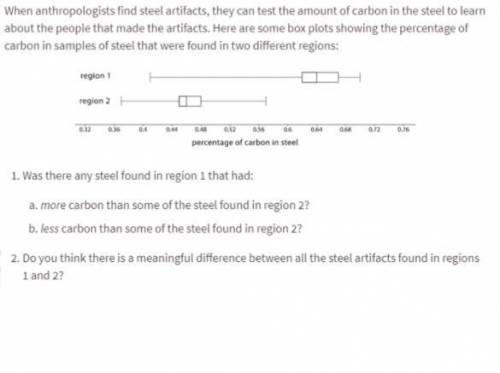
When anthropologists find steel artifacts, they can test the amount pf carbon In the steel to learn about the people that made the artifacts.

Answers: 2


Other questions on the subject: Mathematics
Mathematics, 21.06.2019 17:00, maddiehope6140
Acar travels at an average speed of 56 miles per hour. how long does it take to travel 196 miles
Answers: 1
Mathematics, 21.06.2019 23:00, karyme12
I'm at a bookstore with $\$35$ in my pocket and a $20\%$-off coupon. what is the cost of the most expensive book i can buy with my money and the coupon? (assume that there are books of every possible price in the bookstore. it's a large bookstore! )
Answers: 1
Mathematics, 22.06.2019 02:00, whathelppp
Pleasseee important quick note: enter your answer and show all the steps that you use to solve this problem in the space provided. use the circle graph shown below to answer the question. a pie chart labeled favorite sports to watch is divided into three portions. football represents 42 percent, baseball represents 33 percent, and soccer represents 25 percent. if 210 people said football was their favorite sport to watch, how many people were surveyed?
Answers: 1
Mathematics, 22.06.2019 03:00, dominiqueallen23
Describe how the presence of possible outliers might be identified on the following. (a) histograms gap between the first bar and the rest of bars or between the last bar and the rest of bars large group of bars to the left or right of a gap higher center bar than surrounding bars gap around the center of the histogram higher far left or right bar than surrounding bars (b) dotplots large gap around the center of the data large gap between data on the far left side or the far right side and the rest of the data large groups of data to the left or right of a gap large group of data in the center of the dotplot large group of data on the left or right of the dotplot (c) stem-and-leaf displays several empty stems in the center of the stem-and-leaf display large group of data in stems on one of the far sides of the stem-and-leaf display large group of data near a gap several empty stems after stem including the lowest values or before stem including the highest values large group of data in the center stems (d) box-and-whisker plots data within the fences placed at q1 â’ 1.5(iqr) and at q3 + 1.5(iqr) data beyond the fences placed at q1 â’ 2(iqr) and at q3 + 2(iqr) data within the fences placed at q1 â’ 2(iqr) and at q3 + 2(iqr) data beyond the fences placed at q1 â’ 1.5(iqr) and at q3 + 1.5(iqr) data beyond the fences placed at q1 â’ 1(iqr) and at q3 + 1(iqr)
Answers: 1
You know the right answer?
When anthropologists find steel artifacts, they can test the amount pf carbon In the steel to learn...
Questions in other subjects:
Mathematics, 26.03.2021 09:20
Mathematics, 26.03.2021 09:20

English, 26.03.2021 09:20

English, 26.03.2021 09:20

Chemistry, 26.03.2021 09:20

History, 26.03.2021 09:20


