
Mathematics, 04.05.2021 17:00 Spencerg325
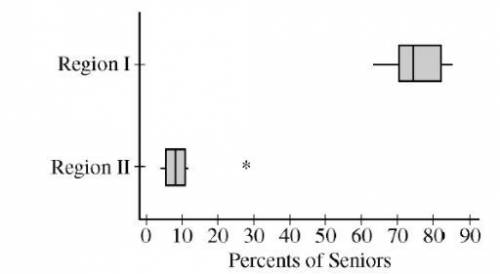
A recruiter at Salisbury University is interested in comparing the percents of high school seniors who plan to go to college in two different regions of the country. The boxplots of the distributions of the percents of seniors who plan to go to college are shown below.
Compare the distributions of the percents of seniors who plan to go to college in the two regions.
The recruiter combined the data from the two regions to produce a single histogram. Describe the shape of the distribution of the combined data.

Answers: 3


Other questions on the subject: Mathematics
Mathematics, 21.06.2019 12:30, BigDaddy1220
Autility company burns coal to generate electricity. the cost c(p), (in dollars) of removing p percent of the some stack pollutants is given by c(p)= 85000p/100-p a) find the cost to remove 30% of the pollutant b) find where the function is undefined
Answers: 3
You know the right answer?
A recruiter at Salisbury University is interested in comparing the percents of high school seniors w...
Questions in other subjects:
Mathematics, 14.01.2021 21:10

Social Studies, 14.01.2021 21:10

History, 14.01.2021 21:10

Mathematics, 14.01.2021 21:10
Mathematics, 14.01.2021 21:10
Mathematics, 14.01.2021 21:10


Arts, 14.01.2021 21:10


