
Mathematics, 03.05.2021 19:50 bridgetosanders
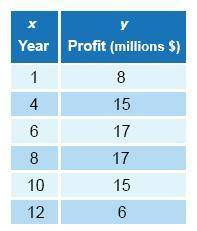
This table shows the profit for a company (in millions of dollars) in different years.
The quadratic regression equation that models these data is y = -0.34x^2 + 4.43x +3.46. Using the quadratic regression equation, what was the predicted profit in year 4?
The answer is $15.74 million
: )

Answers: 1


Other questions on the subject: Mathematics
Mathematics, 21.06.2019 12:30, yashajanjan8550
What is the percent of increase for a population that changed from 438,000 to 561,000
Answers: 1
Mathematics, 21.06.2019 18:00, ykpwincess
Kayla has a $500 budget for the school party. she paid $150 for the decorations. food will cost $5.50 per student. what inequality represents the number of students, s, that can attend the party?
Answers: 1
You know the right answer?
This table shows the profit for a company (in millions of dollars) in different years.
The quadrat...
Questions in other subjects:


Social Studies, 14.11.2020 23:10

Mathematics, 14.11.2020 23:10


