
Mathematics, 03.05.2021 05:40 ashleyacosta
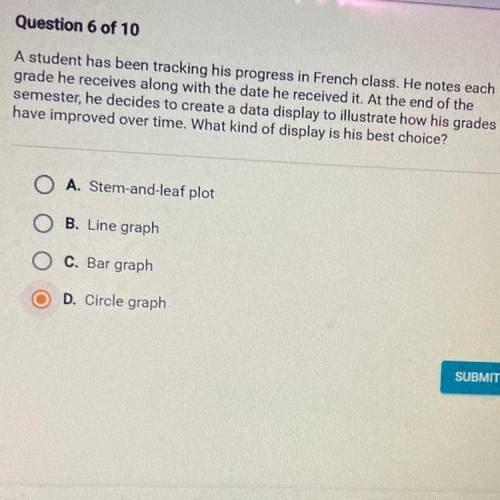
A student has been tracking his progress in French class. He notes each
grade he receives along with the date he received it. At the end of the
semester, he decides to create a data display to illustrate how his grades
have improved over time. What kind of display is his best choice?
O A. Stem-and-leaf plot
O B. Line graph
O C. Bar graph
D. Circle graph

Answers: 2


Other questions on the subject: Mathematics
Mathematics, 21.06.2019 23:40, dontcareanyonemo
The function f(x) is shown in this graph the function g(x)=6x
Answers: 2
Mathematics, 22.06.2019 01:30, katekayrodriguez10
Solve for the equation x. 2x + 22 = 4(x + 3)
Answers: 1
You know the right answer?
A student has been tracking his progress in French class. He notes each
grade he receives along w...
Questions in other subjects:
Mathematics, 17.12.2020 17:20

Arts, 17.12.2020 17:20
Mathematics, 17.12.2020 17:20

Mathematics, 17.12.2020 17:20

Physics, 17.12.2020 17:20


