
Mathematics, 01.05.2021 22:40 missy922527
I accidentally posted the rest of the questions on another post on my account
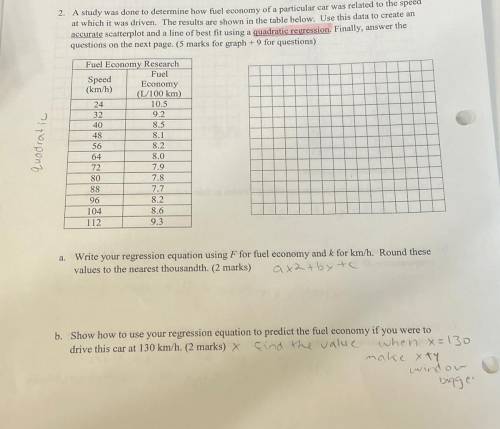
2. A study was done to determine how fuel economy of a particular car was related to the speed
at which it was driven. The results are shown in the table below. Use this data to create an
accurate soatterplot and a line of best fit using a quadratic regression. Finally, answer the
questions on the next page (5 marks for graph + 9 for questions)
Mel Foonomy Research
Fuel
Speed
Boonomy
(U100 km)
103
9,2
8.3
quodratic
04
72
SO
SS
8.2
SO
7.9
7.8
7.7
8.2
8.6
9.3
104
112
Write your regression equation using F for fuel economy and k for km/h. Round these

Answers: 1


Other questions on the subject: Mathematics
Mathematics, 21.06.2019 15:20, heyrosaphoto3159
The speed of a falling object increases at a constant rate as time increases since the object was dropped. which graph could represent the relationship betweent time in seconds, and s, speed in meters per second? speed of a falling object object over time
Answers: 1
Mathematics, 21.06.2019 19:30, fraven1819
:24% of students in a class are girls. if there are less than 30 students in this class, how many students are there? how many girls are there?
Answers: 2
Mathematics, 21.06.2019 20:00, demetriascott20
Write the point-slope form of the line passing through (2, -12) and parallel to y=3x.
Answers: 2
Mathematics, 21.06.2019 20:30, Mgarcia325
Justin has 750 more than eva and eva has 12 less than justin together they have a total of 63 how much money did
Answers: 1
You know the right answer?
I accidentally posted the rest of the questions on another post on my account
2. A study was done...
Questions in other subjects:


History, 27.05.2020 02:03


