Help please! No links!
Task: Use the scatter plot to answer Parts A and B.
The scatter...

Mathematics, 01.05.2021 08:30 fruitsnaxFTW1079
Help please! No links!
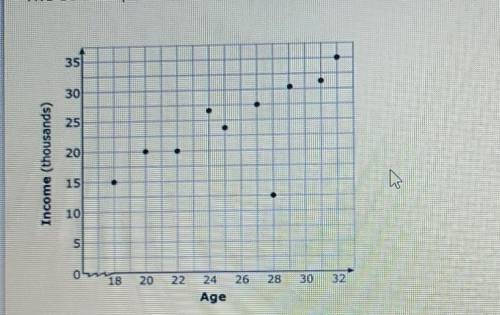
Task: Use the scatter plot to answer Parts A and B.
The scatter plot shows the average yearly income based on age.
Complete each of the 2 activities for this
Task. Activity 1 of 2
What are the coordinates of the outlier in the scatter plot? SHOW YOUR WORK
Activity 2 of 2
Based on the data including an outlier, Which measure would better describe the data?
A. The Mean
B. The Median
C. Neither

Answers: 1


Other questions on the subject: Mathematics
Mathematics, 21.06.2019 22:00, nyceastcoast
Percent increase and decrease. original number: 45 new number: 18
Answers: 1
Mathematics, 21.06.2019 23:40, aureliafung2p7cxoo
Mikes car gets an average of 28 mpg. there are 12 gallons of fuel in mikes car when he starts his trip of 140 miles. about how many gallons are left at the end of his trip?
Answers: 1
Mathematics, 22.06.2019 03:10, maysen2001
(co 3) the times that customers spend in a book store are normally distributed with a mean of 39.5 minutes and a standard deviation of 9.4 minutes. a random sample of 25 customers has a mean of 36.1 minutes or less. would this outcome be considered unusual, so that the store should reconsider its displays? no, the probability of this outcome at 0.035, would be considered usual, so there is no problem yes, the probability of this outcome at 0.035, would be considered unusual, so the display should be redone no the probability of this outcome at 0.359 would be considered usual, so there is no problem yes, the probability of this outcome at 0.965 would be considered unusual, so the display should be redone
Answers: 1
You know the right answer?
Questions in other subjects:
Mathematics, 29.11.2019 03:31

Mathematics, 29.11.2019 03:31


