
Mathematics, 01.05.2021 04:20 bettyrose69
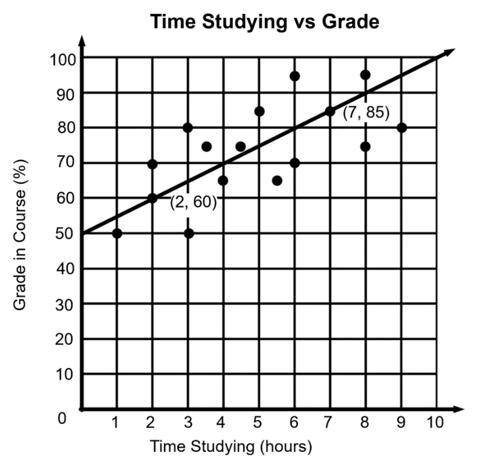
7. The scatter plot below suggests a linear relationship between time spent studying and the grade earned in their math course.
Part A: What does the rate of change, or slope, of the trend line represent in this situation?
The score earned for zero hours of studying
The score earned for 10 hours of studying
How much the grade increase for every hour of studying
How much the hours increase for every grade increase
Part A: What does the rate of change, or slope, of the trend line represent in this situation?
The score earned for zero hours of studying
The score earned for 10 hours of studying
How much the grade increase for every hour of studying
How much the hours increase for every grade increase

Answers: 3


Other questions on the subject: Mathematics
Mathematics, 21.06.2019 19:00, dfrtgyuhijfghj4794
Since opening night, attendance at play a has increased steadily, while attendance at play b first rose and then fell. equations modeling the daily attendance y at each play are shown below, where x is the number of days since opening night. on what day(s) was the attendance the same at both plays? what was the attendance? play a: y = 8x + 191 play b: y = -x^2 + 26x + 126 a. the attendance was never the same at both plays. b. the attendance was the same on day 5. the attendance was 231 at both plays on that day. c. the attendance was the same on day 13. the attendance was 295 at both plays on that day. d. the attendance was the same on days 5 and 13. the attendance at both plays on those days was 231 and 295 respectively.
Answers: 1
Mathematics, 21.06.2019 20:00, jpsaad00
Beth divided 9 ounces of her granola recipe into 4 equal-sized amounts. she placed the amounts into individual bowls. the fraction 9/4 represents the number of ounces of granola in each bowl. which other number represents the amount of granola beth has in each bowl? (a) 1 1/4 (b) 2 1/4 (c) 1 3/4 (d) 3 3/4 i need !
Answers: 2
You know the right answer?
7. The scatter plot below suggests a linear relationship between time spent studying and the grade e...
Questions in other subjects:

Mathematics, 23.05.2020 23:02


Biology, 23.05.2020 23:02

Business, 23.05.2020 23:02
Mathematics, 23.05.2020 23:02


