
Mathematics, 30.04.2021 23:00 oliviaciscooc
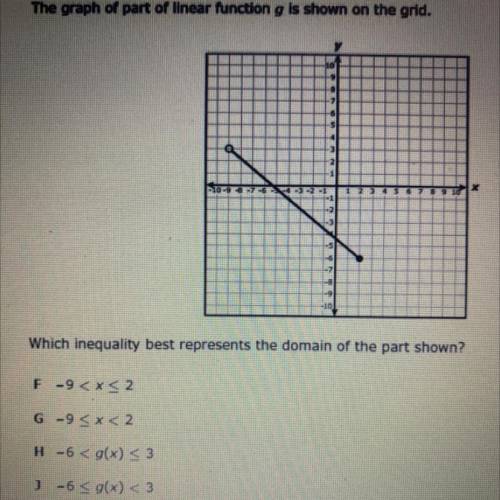
The graph of part of linear function g is shown on the grid.
Which inequality best represents the domain of the part shown?
F-9
G-9 < X<2
H -6 < g(x) 53
3
-6 5 g(x) < 3
* LIITTI

Answers: 2


Other questions on the subject: Mathematics
Mathematics, 21.06.2019 22:30, BigGirlsTheBest
At the beginning of year 1, carlos invests $600 at an annual compound interest rate of 4%. he makes no deposits to or withdrawals from the account. which explicit formula can be used to find the account's balance at the beginning of year 5? what is, the balance?
Answers: 1
Mathematics, 22.06.2019 01:30, bellaforlife9
Amayoral candidate would like to know her residents’ views on a tax on sugar drinks before the mayoral debates. she asks one thousand registered voters from both parties. these voters are an example of a census population convenience sample simple random sample
Answers: 1
You know the right answer?
The graph of part of linear function g is shown on the grid.
Which inequality best represents the...
Questions in other subjects:
Mathematics, 20.10.2020 21:01

History, 20.10.2020 21:01


Mathematics, 20.10.2020 21:01
History, 20.10.2020 21:01


