
Mathematics, 30.04.2021 21:40 Nathanr23
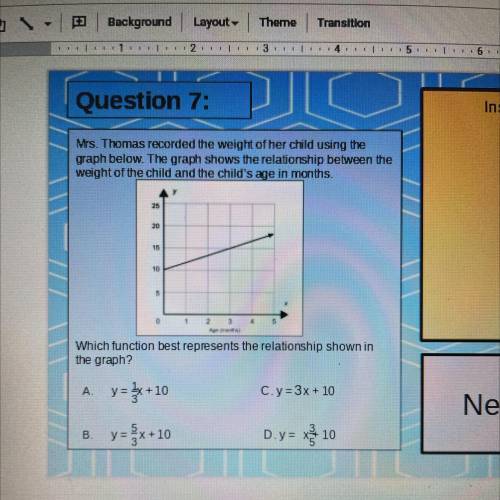
Mrs. Thomas recorded the weight of her child using the
graph below. The graph shows the relationship between the
weight of the child and the child's age in months.
25
20
15
10
5
1
2
3
Which function best represents the relationship shown in
the graph?
A. y= {x+10
C. y=3x + 10
B
y=-x+10
D. y= xỷ 10

Answers: 1


Other questions on the subject: Mathematics
Mathematics, 21.06.2019 15:50, winterblanco
Which of the following is the equation that says that the product of a number and ten is equal to 20 percent of that number ? a) 10n= 2.0n b) 10+n=.20n c) n+ .20n=10 d) 10n=0.20n
Answers: 1
Mathematics, 21.06.2019 16:30, shadowentity43
Question 5 spring semester final exam math evaluate
Answers: 1
Mathematics, 21.06.2019 17:30, kaliebeckp8vqrs
11. a particular type of cell doubles in number every hour. which function can be used to find the number of cells present at the end of h hours if there are initially 4 of these cells? a. n = 4 ()" b. n = 4(2)" c. n = 4 + (2)" din = 4 +"
Answers: 1
You know the right answer?
Mrs. Thomas recorded the weight of her child using the
graph below. The graph shows the relations...
Questions in other subjects:


Chemistry, 03.05.2021 20:30

Mathematics, 03.05.2021 20:30

History, 03.05.2021 20:30
Mathematics, 03.05.2021 20:30


