
Mathematics, 30.04.2021 21:40 ElizabethF
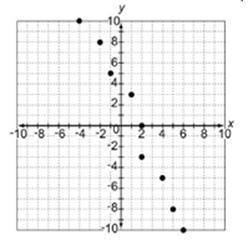
Consider the scatter plot.
Which of the following statements BEST describes the association?
A. The data shows a positive association with a trend line of y = 2x - 3.
B. The data shows a negative association with a trend line of y = -2x - 3.
C. The data shows a negative association with a trend line of y = -2x + 3.
D. The data shows a positive association with a trend line of y = 2x + 3.

Answers: 3


Other questions on the subject: Mathematics
Mathematics, 21.06.2019 18:00, xxaurorabluexx
Suppose you are going to graph the data in the table. minutes temperature (°c) 0 -2 1 1 2 3 3 4 4 5 5 -4 6 2 7 -3 what data should be represented on each axis, and what should the axis increments be? x-axis: minutes in increments of 1; y-axis: temperature in increments of 5 x-axis: temperature in increments of 5; y-axis: minutes in increments of 1 x-axis: minutes in increments of 1; y-axis: temperature in increments of 1 x-axis: temperature in increments of 1; y-axis: minutes in increments of 5
Answers: 2
Mathematics, 21.06.2019 20:30, alannadiaz1
Two triangles can be formed with the given information. use the law of sines to solve the triangles. b = 49°, a = 16, b = 14
Answers: 3
Mathematics, 21.06.2019 21:00, datgamer13
Mr. zimmerman invested $25,000 in an account that draws 1.4 interest, compouneded annually. what is the total value of the account after 15 years
Answers: 1
You know the right answer?
Consider the scatter plot.
Which of the following statements BEST describes the association?
Questions in other subjects:

History, 03.07.2019 00:30

English, 03.07.2019 00:30


Biology, 03.07.2019 00:30
Mathematics, 03.07.2019 00:30

Mathematics, 03.07.2019 00:30


