
Mathematics, 30.04.2021 06:30 Lexiah
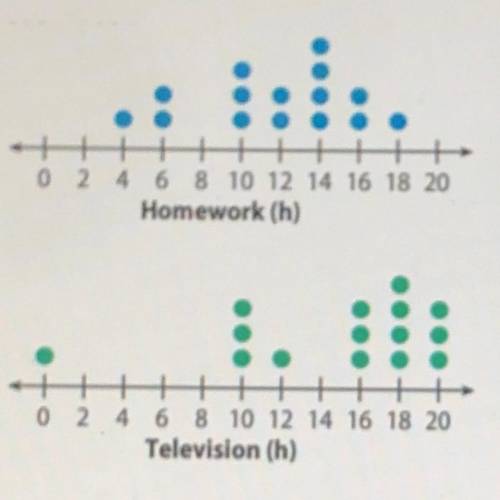
Numerically compare the dot plots of the number of hours a class of students
spends on homework to the number of hours they watch television each week.
0 2 4 6 8 10 12 14 16 18 20
Homework (h)
0 2 4 6 8 10 12 14 16 18 20
Television (h)

Answers: 1


Other questions on the subject: Mathematics
Mathematics, 21.06.2019 20:00, alisonlebron15
An investment decreases in value by 30% in the first year and decreases by 40% in the second year. what is the percent decrease in percentage in the investment after two years
Answers: 1
Mathematics, 21.06.2019 21:30, kingdrew27
Due to a packaging error, 4 cans labeled diet soda were accidentally filled with regular soda and placed in a 12 pack carton of diet soda. two cans were randomly selected from this 12 pack. what is the probability that both cans were regular soda?
Answers: 2
You know the right answer?
Numerically compare the dot plots of the number of hours a class of students
spends on homework to...
Questions in other subjects:

Mathematics, 15.07.2020 02:01
Mathematics, 15.07.2020 02:01

Mathematics, 15.07.2020 02:01
Mathematics, 15.07.2020 02:01


